The signal
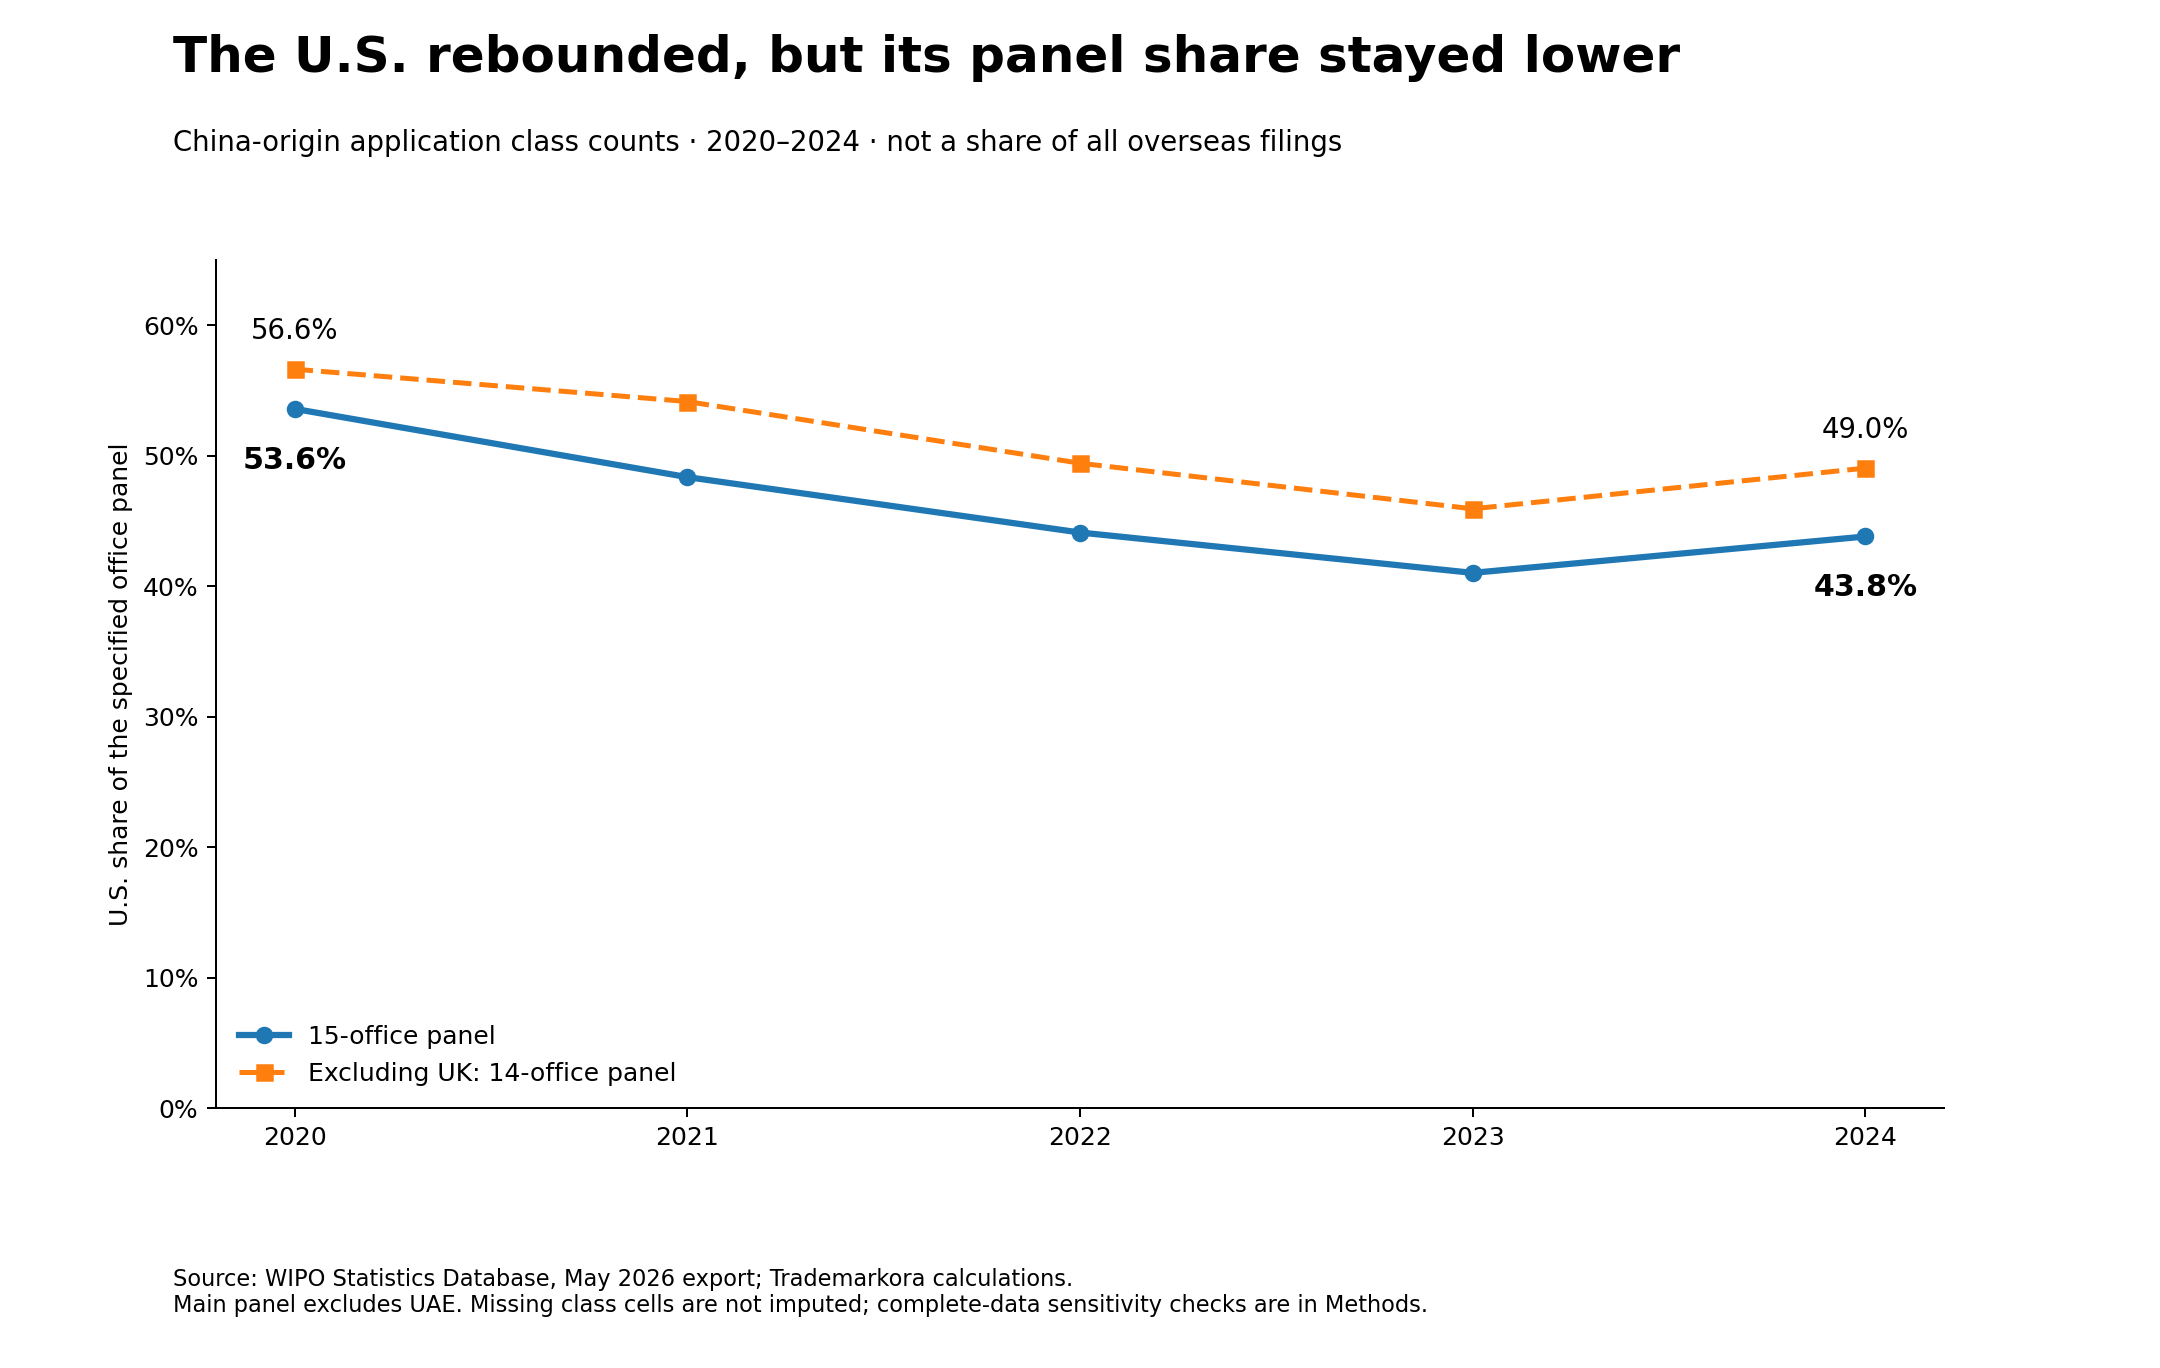
Chinese-origin counts at the U.S. office rose from 180,483 in 2020 to 185,102 in 2021, fell to 117,487 in 2022, were nearly unchanged in 2023 and rebounded to 160,792 in 2024. The recovery is real in this series. It did not restore the 2021 peak.
Source: WIPO Statistics Database;Trademarkora calculations. The package uses a May 2026 data vintage; see Methods for scope and caveats.
Why the denominator matters
The 43.8% value does not mean that 43.8% of every Chinese overseas filing went to the U.S. It means that the U.S. contributed that share of reported application-class counts in the specified panel and years. The aggregate cannot identify whether portfolios were substituted, expanded or filed by different groups.
The combined panel increased from 336,813 reported class counts in 2020 to 367,069 in 2024. The non-U.S. portion increased from 156,330 to 206,277. The narrow conclusion is that, within this fixed set of office channels, activity was less U.S.-concentrated in 2024 than in 2020.
Sensitivity, not certainty
The direction survives removing the UK, removing the UK plus overlapping German and French national-office channels, and using the nine offices with complete class-year cells. These checks do not convert the panel into a complete global denominator.
What this does not prove
- Chinese applicants abandoned the U.S.
- Unique marks, companies, sales, exports or market share.
- The cause of the 2022 drop or 2024 rebound.
Cite this research
Suggested citation for articles, briefings and chart reuse:
Lin, Peter. “Beyond the U.S. Rebound: The Changing Map of Chinese Trademark Filings.” Trademarkora Global Trademark Signals, Data Note 01, 21 September 2026. WIPO Statistics Database, May 2026 data vintage.