Growth from different bases
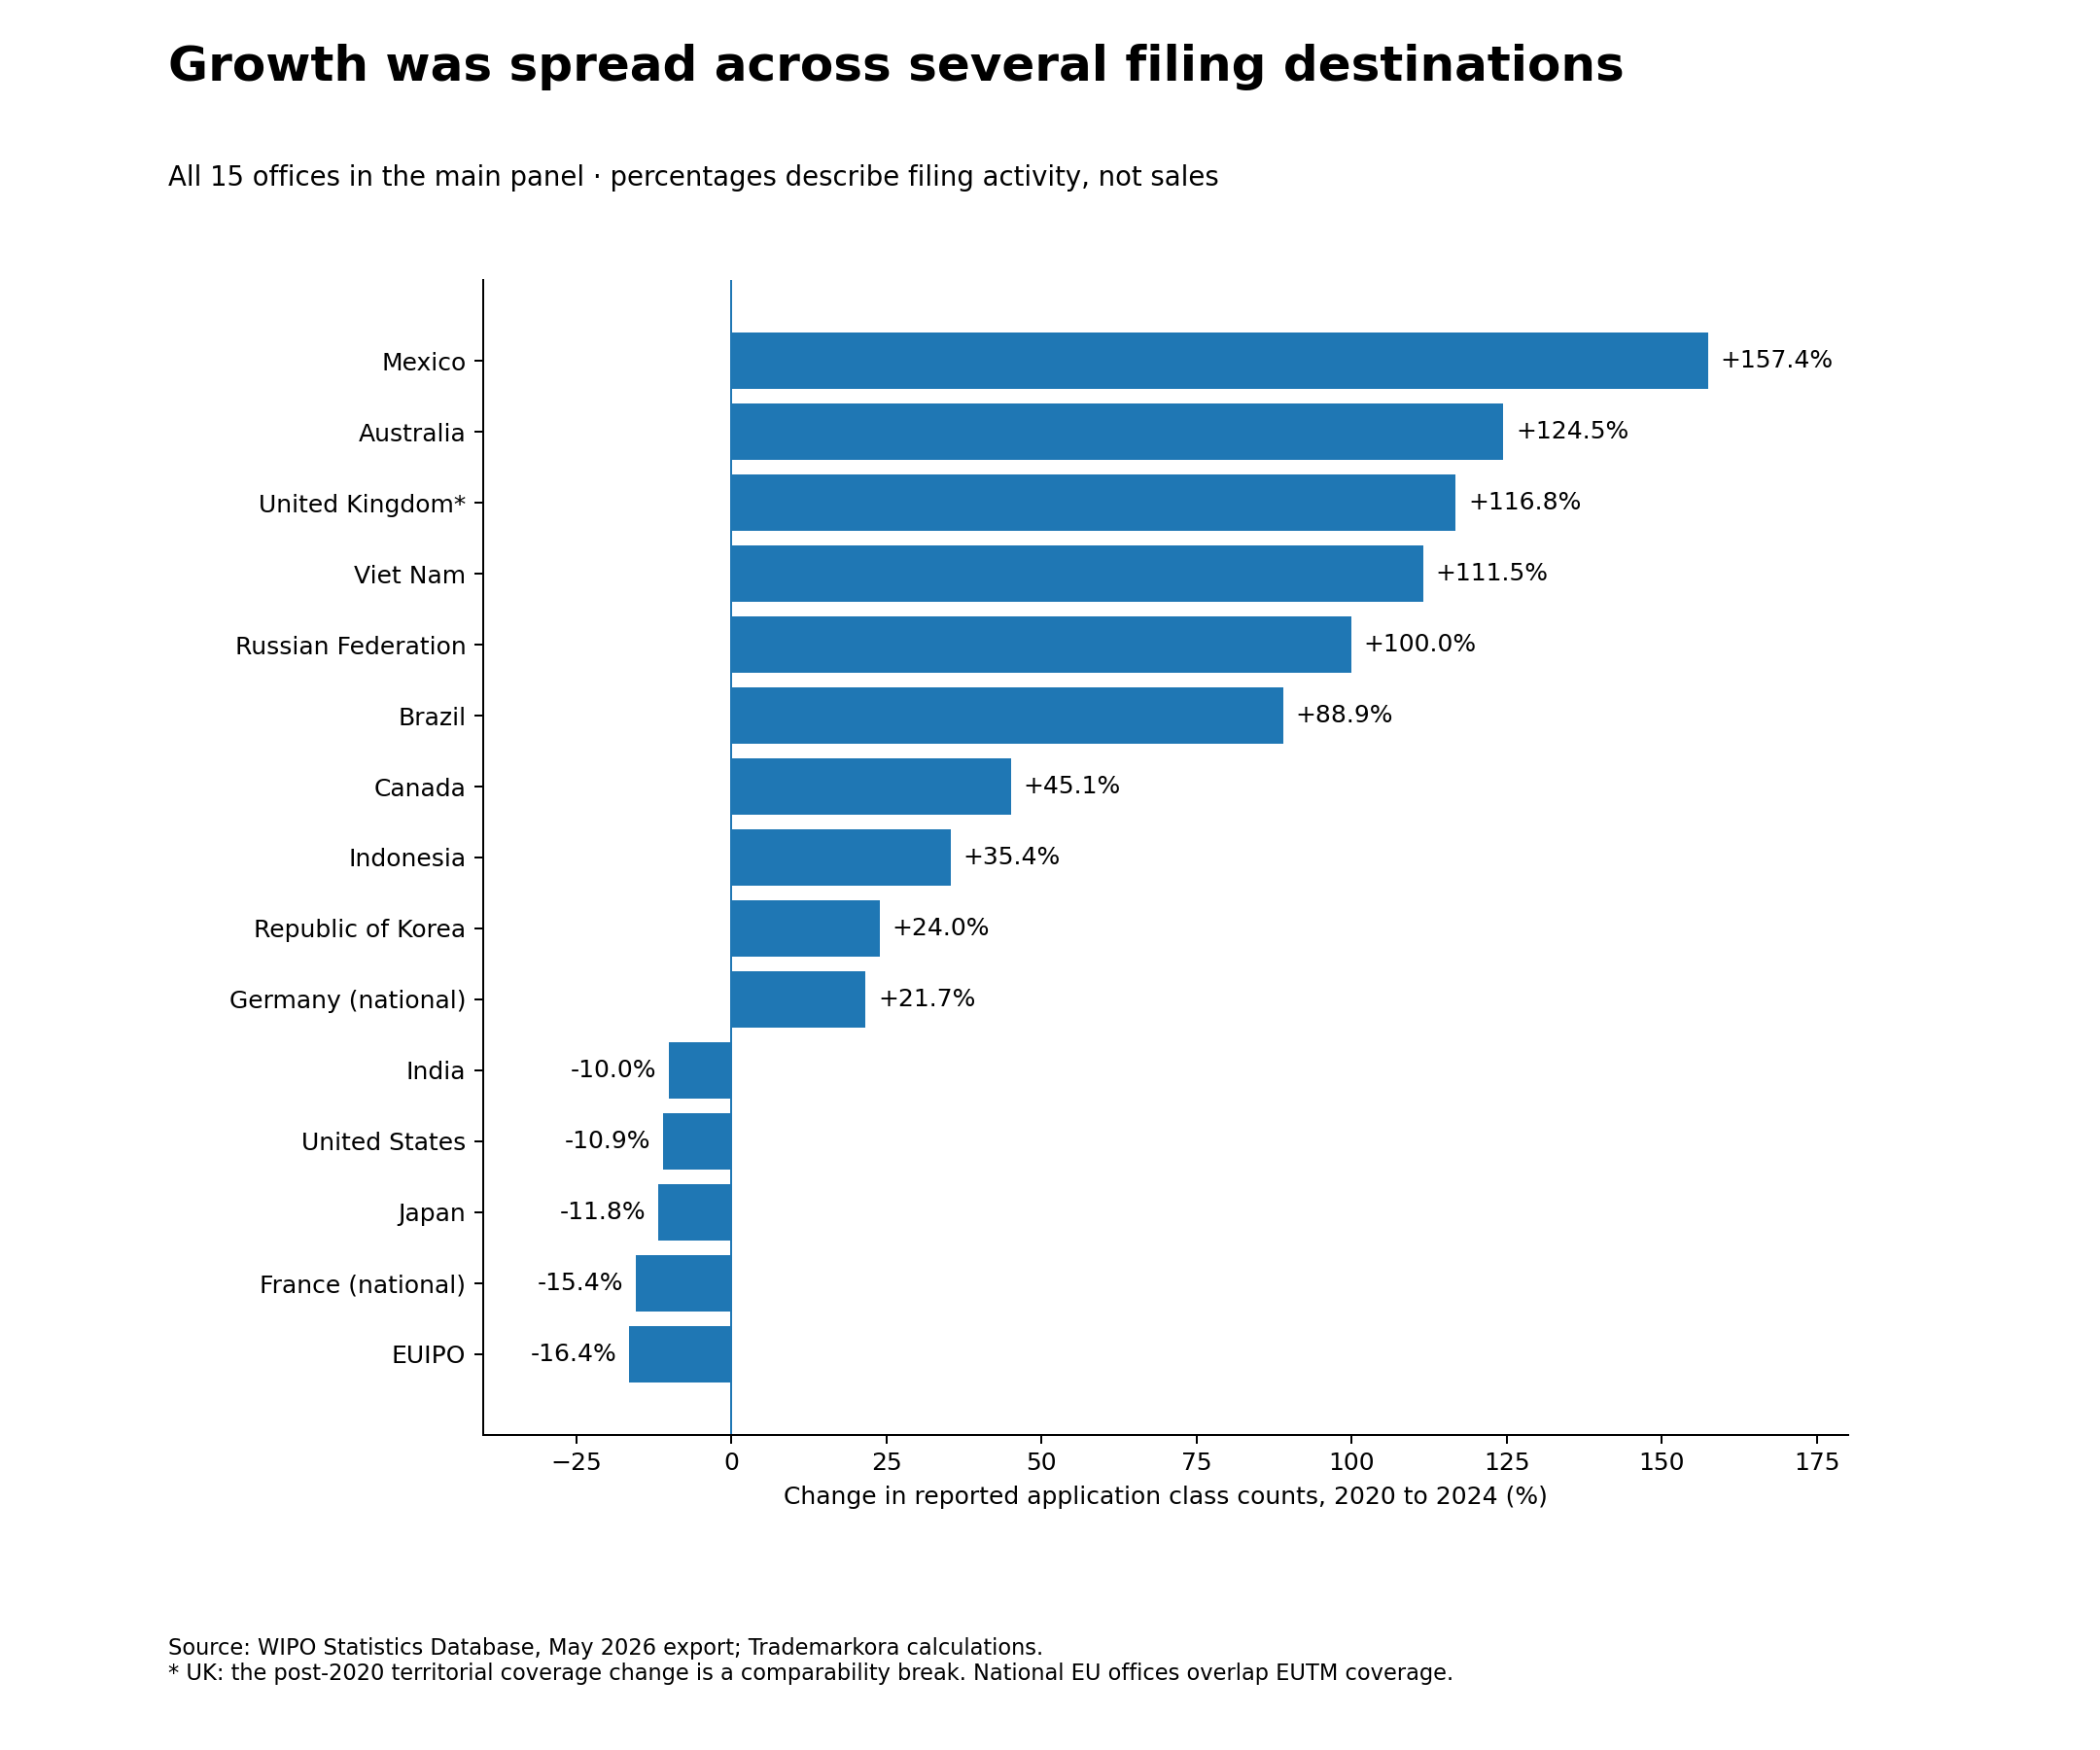
Mexico rose from 3,744 to 9,637 reported class counts. Australia rose from 6,179 to 13,870, and Viet Nam from 6,045 to 12,788. Russia approximately doubled and Brazil increased 88.9%. Percentage growth makes the change visible, but absolute counts and starting bases remain important.
Source: WIPO Statistics Database;Trademarkora calculations. The package uses a May 2026 data vintage; see Methods for scope and caveats.
What the chart can—and cannot—say
The defensible observation is a rebound at the largest destination alongside faster growth in several other office channels. The data do not show abandonment, one-for-one substitution or a typical company’s portfolio.
| Office | 2020 | 2024 | Change |
|---|---|---|---|
| Mexico | 3,744 | 9,637 | +157.4% |
| Australia | 6,179 | 13,870 | +124.5% |
| Viet Nam | 6,045 | 12,788 | +111.5% |
| Brazil | — | — | +88.9% |
The office totals are sums of reported class observations, not unique applications. The same mark can be represented in multiple offices; a single multiclass filing can contribute more than one class count.
Next research question
Office-level breadth is not applicant-level breadth. Asking whether the typical applicant diversified its geographic portfolio would require reliable applicant matching across offices, which the supplied WIPO aggregate does not provide.
What this does not prove
- Sales, export, market entry or commercial success.
- The cause of growth in any office.
- National EU offices and EUIPO are independent territorial units.
Cite this research
Suggested citation for articles, briefings and chart reuse:
Lin, Peter. “Beyond the U.S. Rebound: The Changing Map of Chinese Trademark Filings.” Trademarkora Global Trademark Signals, Data Note 02, 21 September 2026. WIPO Statistics Database, May 2026 data vintage.