Trademarkora Research

Global Trademark Signals

Original data and analysis on where brands seek trademark protection, what they protect, and how those patterns change.
Research franchise · Issue 01Evidence first · No email gate
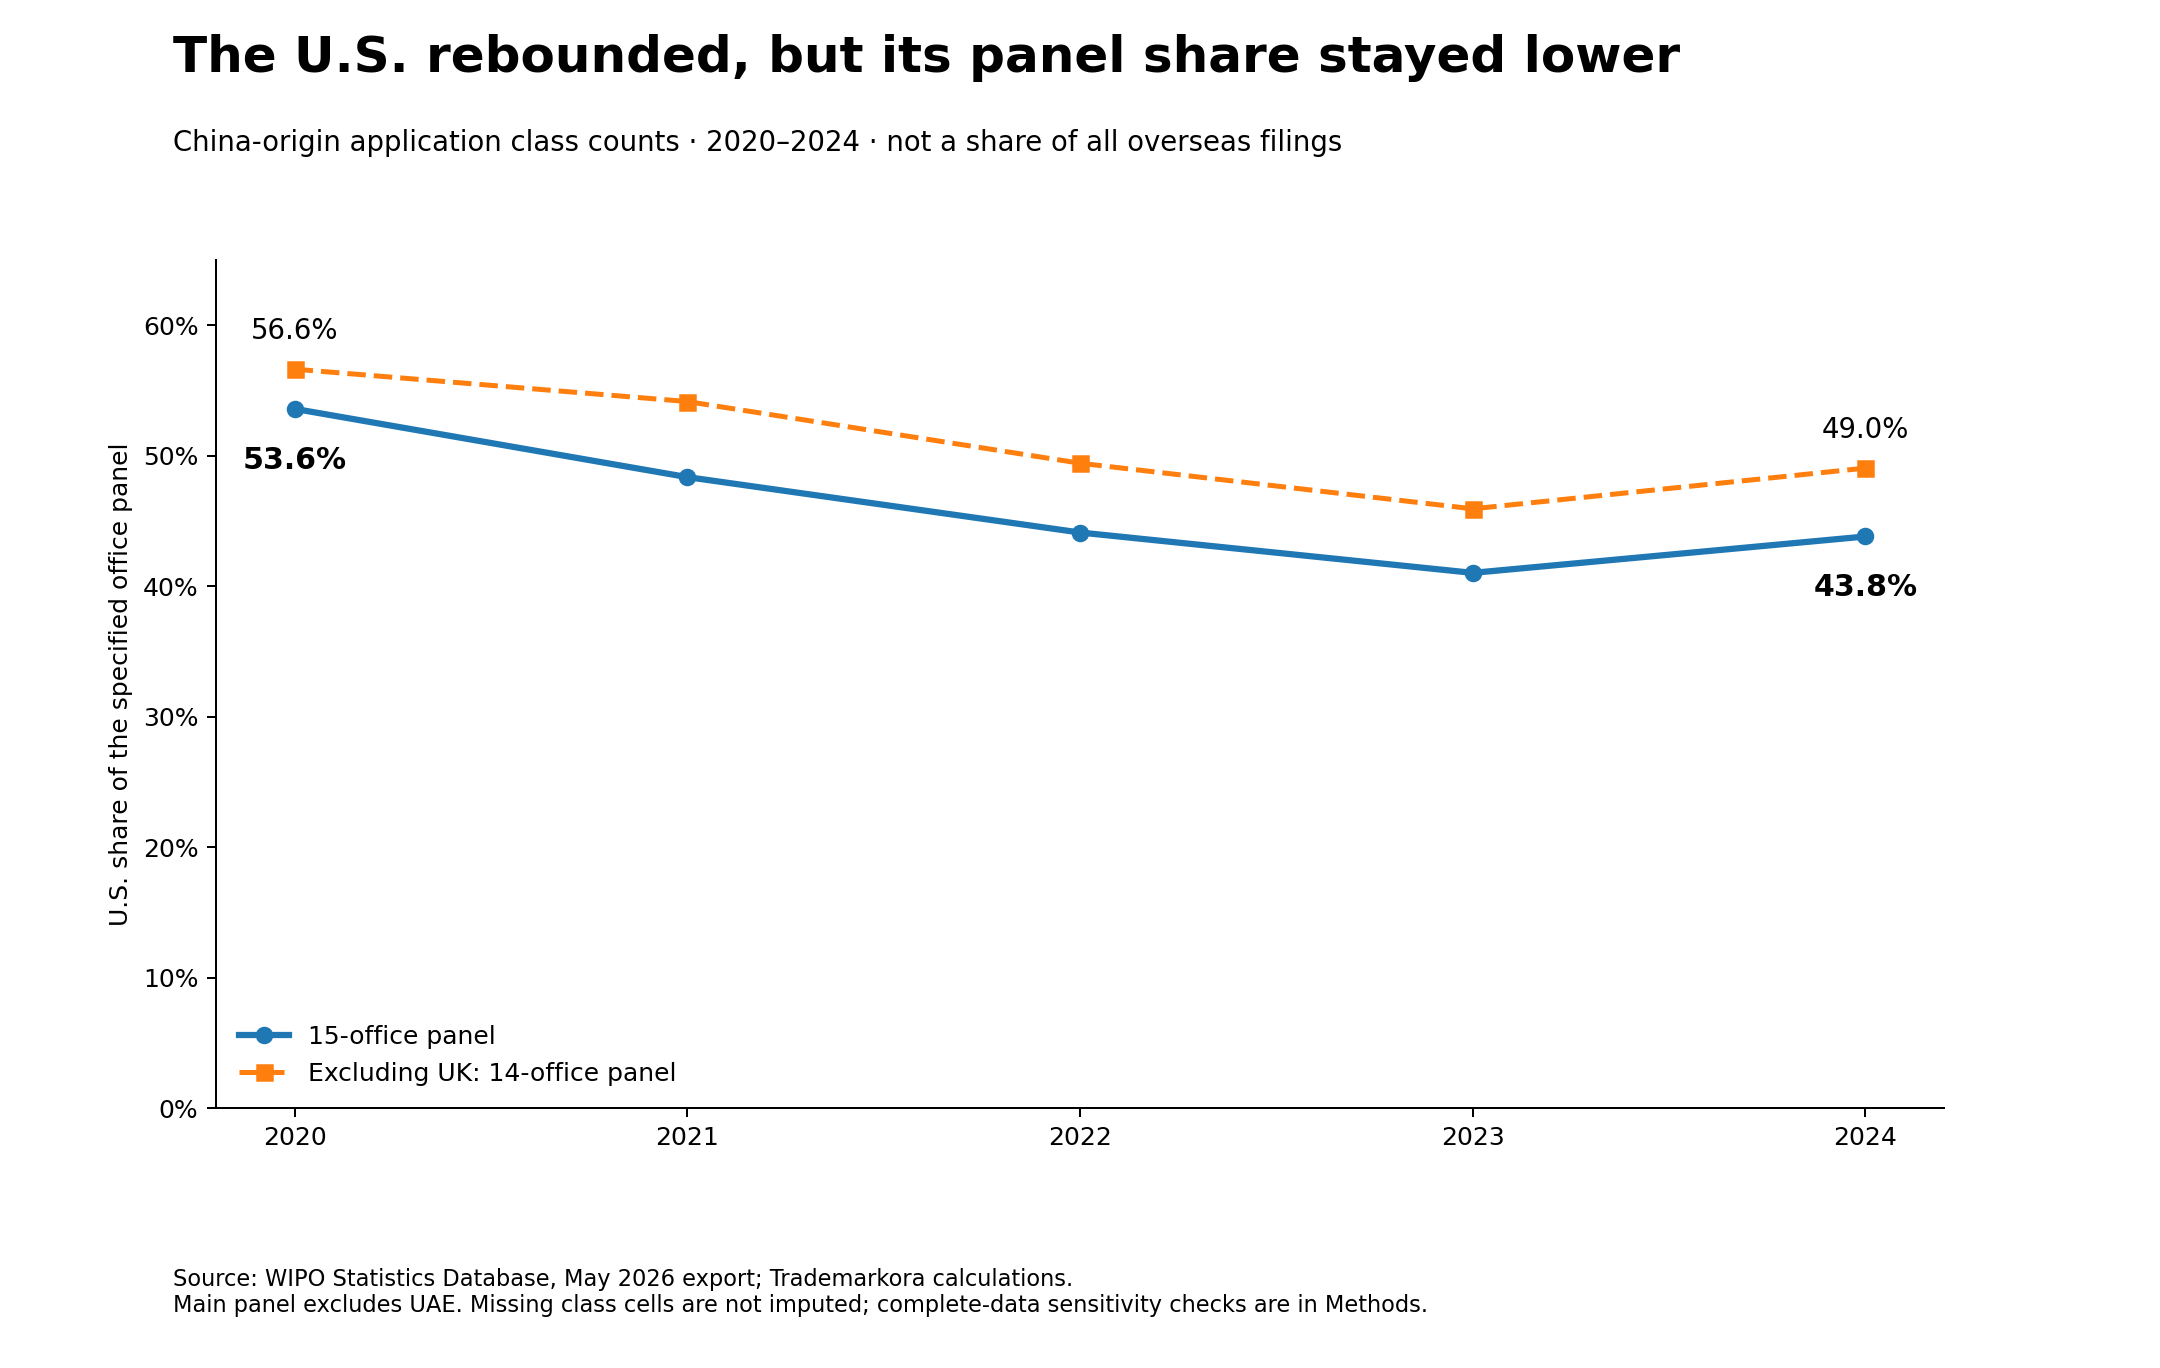
The U.S. share of 15 selected offices falls from 53.6% in 2020 to 43.8% in 2024. Excluding the UK, it falls from 56.6% to 49.0%.
The first signal: a wider map than a single U.S. filing total suggests.WIPO · 2020–2024
43.8%U.S. share of the selected-office panel in 2024, down from 53.6% in 2020
+157.4%Mexico reported class-count growth from 2020 to 2024
15Selected filing offices in the main panel; UAE is outside the headline

Latest signals

Short reports built from a stated scope, a visible unit and a chart that can stand alone when shared.

GLOBAL TRADEMARK SIGNALS · ISSUE 01

美国反弹之外:中国商标申请地图的变化

旗舰报告以 15 个选定办公室的固定面板,说明美国集中度降低和商品组合变化。

Read the research →
DATA NOTE 01 · DESTINATION SHARE

美国反弹,但面板占比仍然较低

聚焦 53.6% 到 43.8% 变化背后的选定办公室分母。

Read the research →
DATA NOTE 02 · OFFICE GROWTH

多个目的地从不同起点增长

墨西哥、澳大利亚和越南的申报类别计数均超过翻倍,但这不是替代故事。

Read the research →

Explore by lens

A taxonomy for real research, not a grid of empty regional or sector pages.

GlobalCross-office and cross-class signals when the denominator is explicit.
RegionsOnly when a distinct office set and evidence can support the comparison.
MarketsOffice-level flows, territorial boundaries and source limitations.
SectorsClass patterns with the caution that Nice classes are broad.
Evidence layer

Trademark Data Lab

The Data Lab is a later U.S. record-level snapshot: seven selected Nice classes, September 2025–August 2026, with recorded applicant names and individual applications. It is not the WIPO 2020–2024 cross-office study behind Issue 01.

75,806category-record rows across seven selected U.S. classes
55,315exact recorded applicant-name strings across the R2 snapshot

Methods, sources and reuse

Every report states its data vintage, unit, denominator, missingness and what the evidence does not prove.

Methods & sources

Read the evidence with its boundaries

WIPO source attribution, UK/Brexit treatment, UAE missingness and the difference between class counts and unique applications are part of the report.

Read the research →
Cite this research

Use the chart of record

Download PNG, SVG and derived aggregate CSV files without an email gate; reuse with attribution and a link back.

Read the research →