The finding in one minute
The U.S. recovery is only part of the story. Across a fixed panel of 15 selected trademark offices, Chinese-origin application class counts at the U.S. office were 10.9% lower in 2024 than in 2020. Counts at the other 14 offices combined were 31.9% higher. The U.S. share fell from 53.6% to 43.8%, despite a substantial rebound in 2024.
Mexico, Australia and Viet Nam each more than doubled their reported class counts. The UK also more than doubled relative to 2020, but that comparison crosses a change in territorial trademark coverage; in 2024, UK counts were still below their 2021 level.
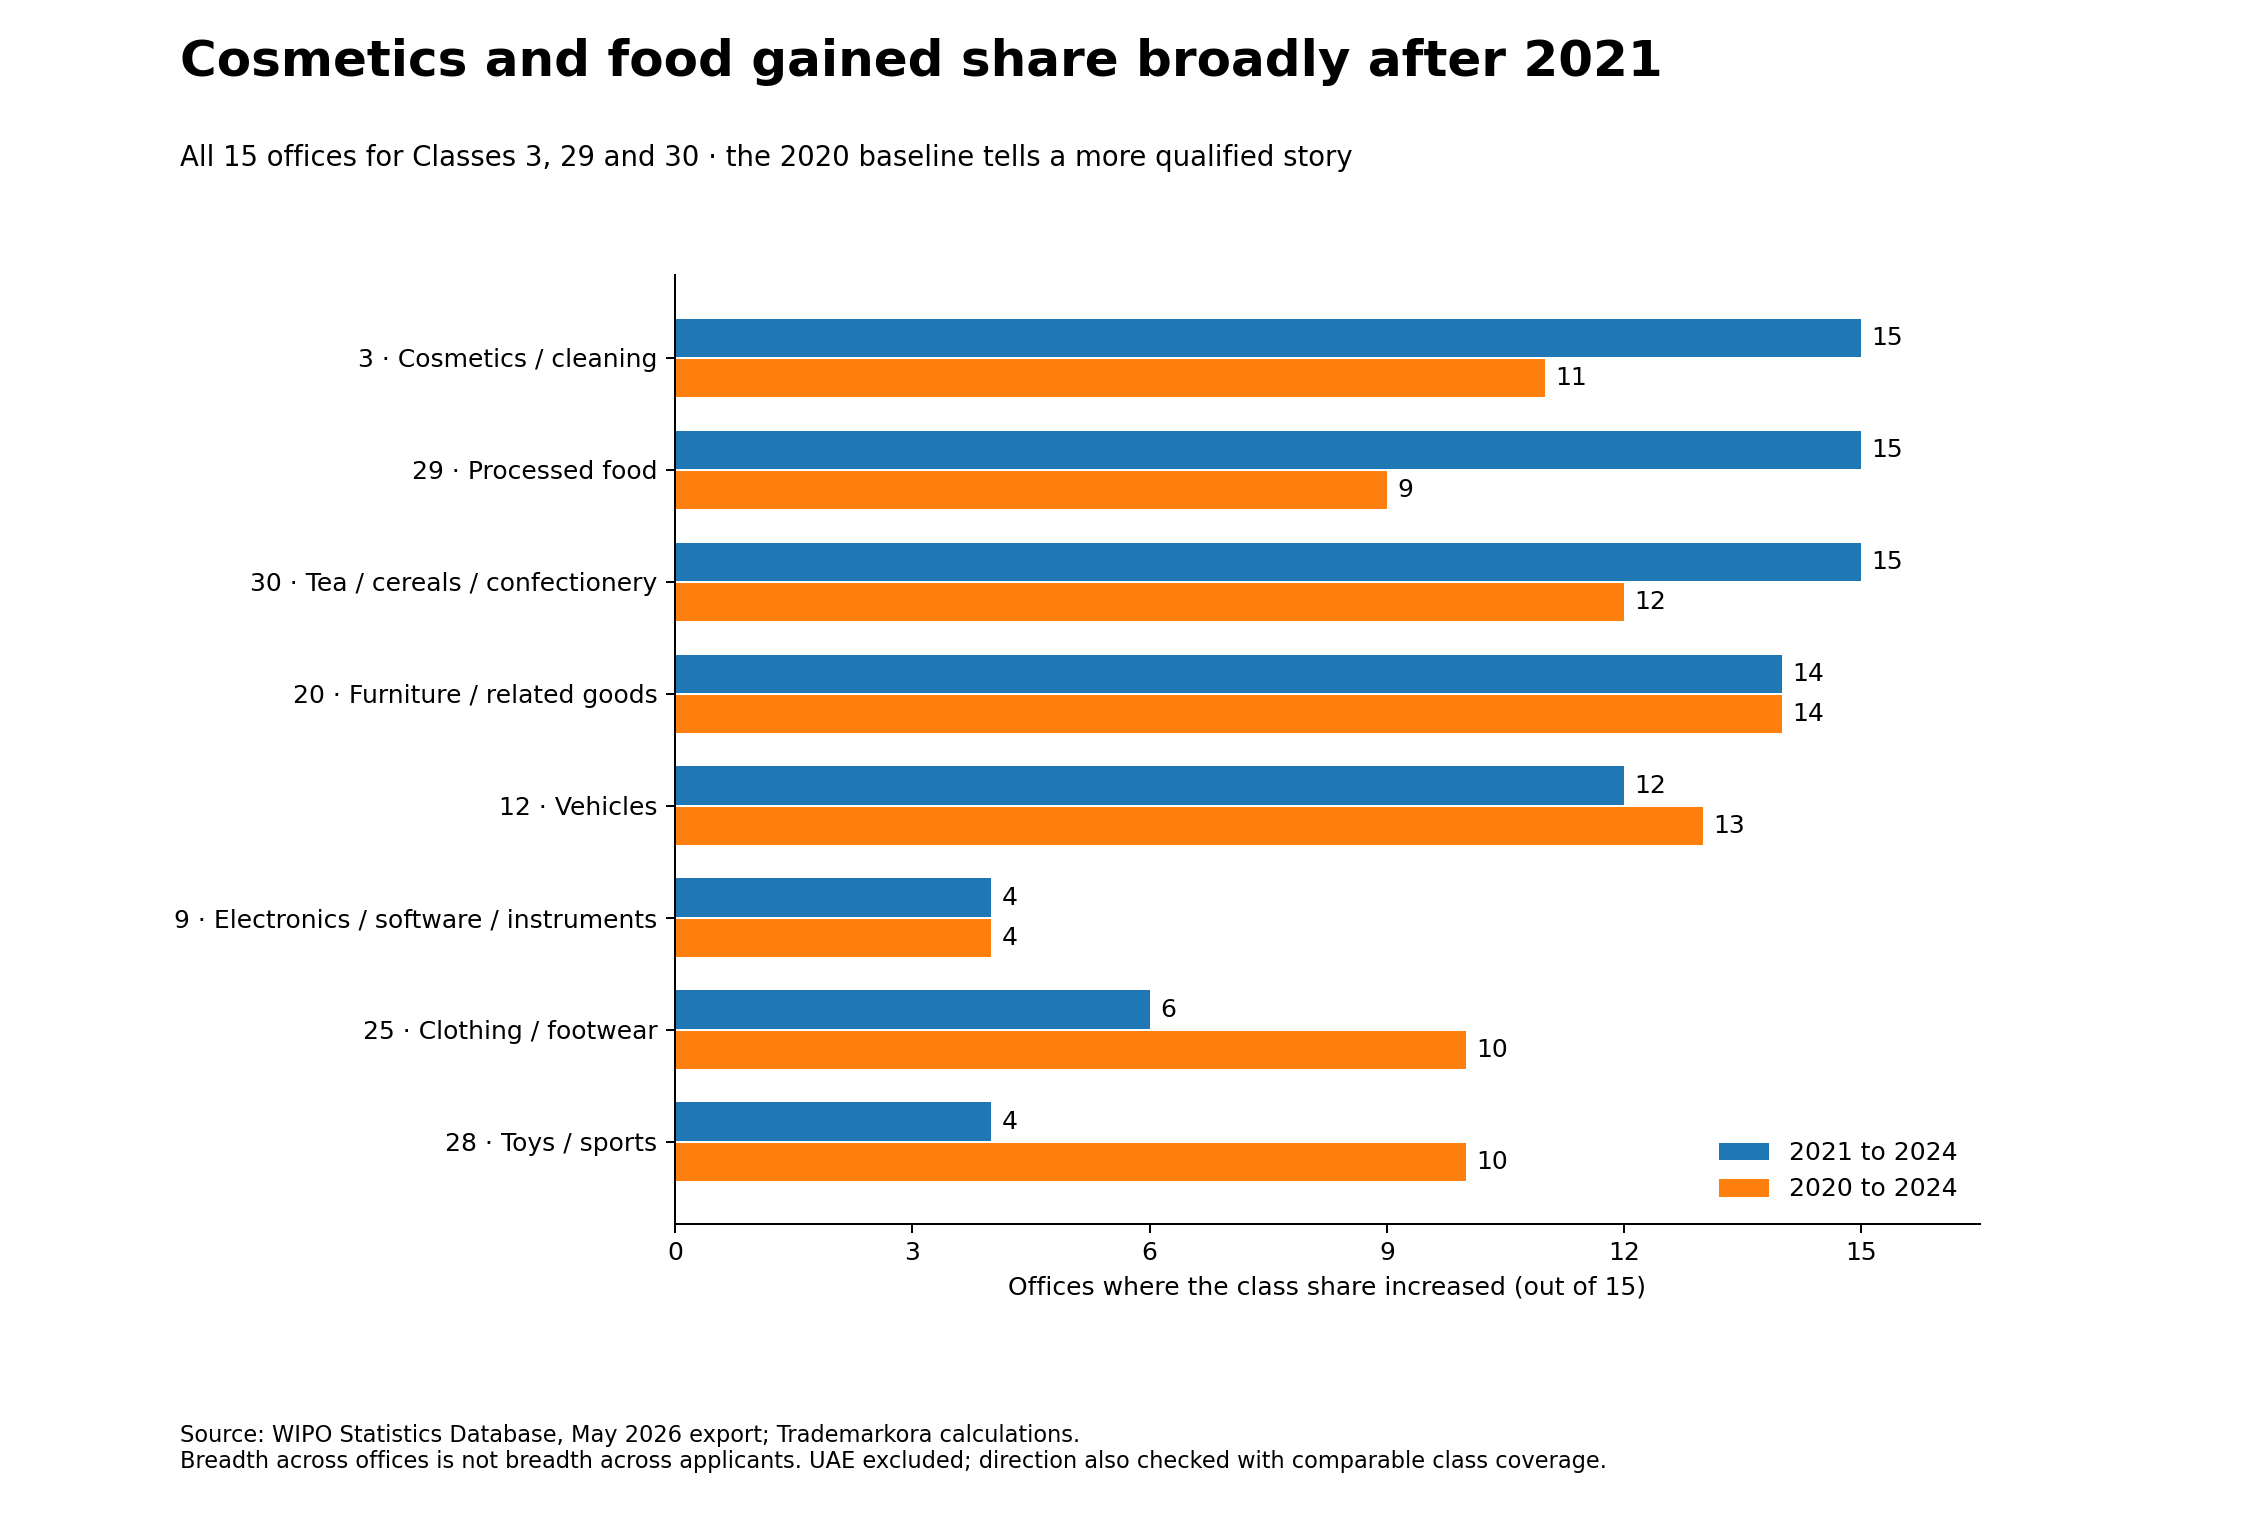
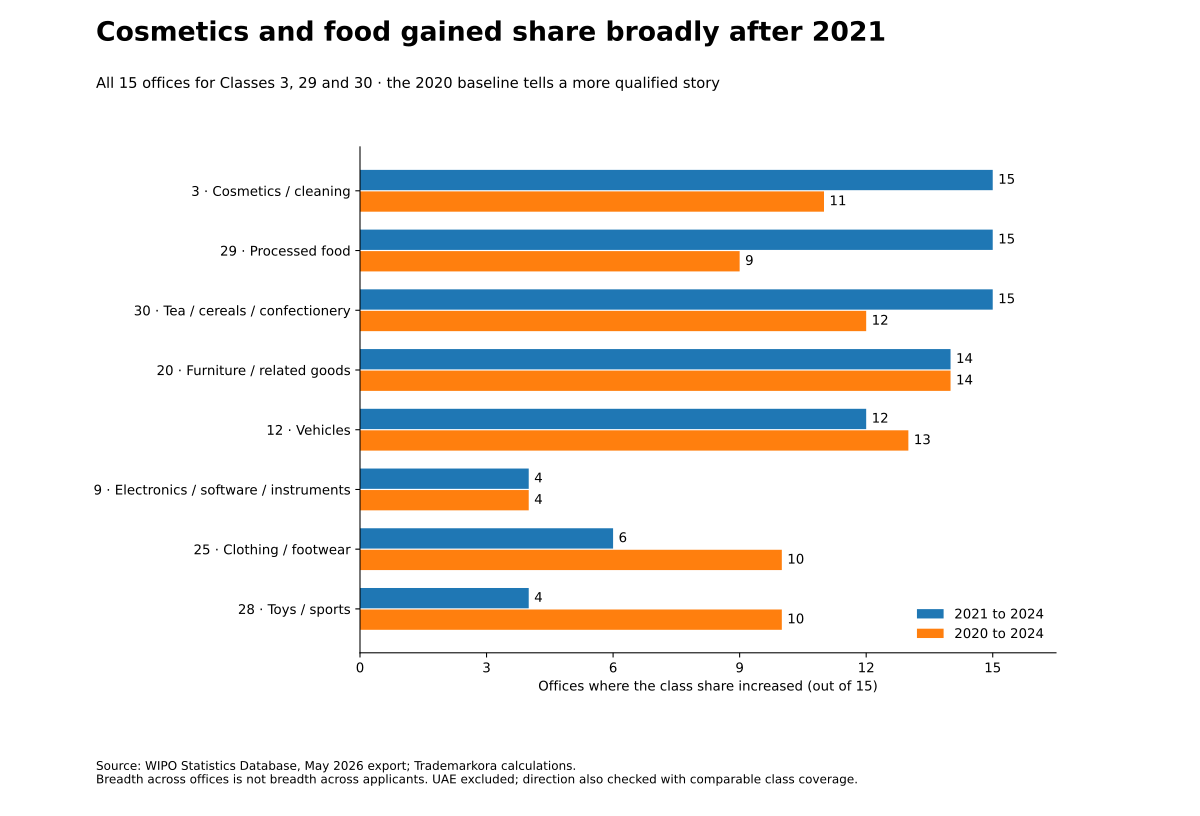
Between 2021 and 2024, Class 3, Class 29 and Class 30 each gained share in all 15 offices in the main panel. This is a broad protection-mix signal, not a count of independent companies.
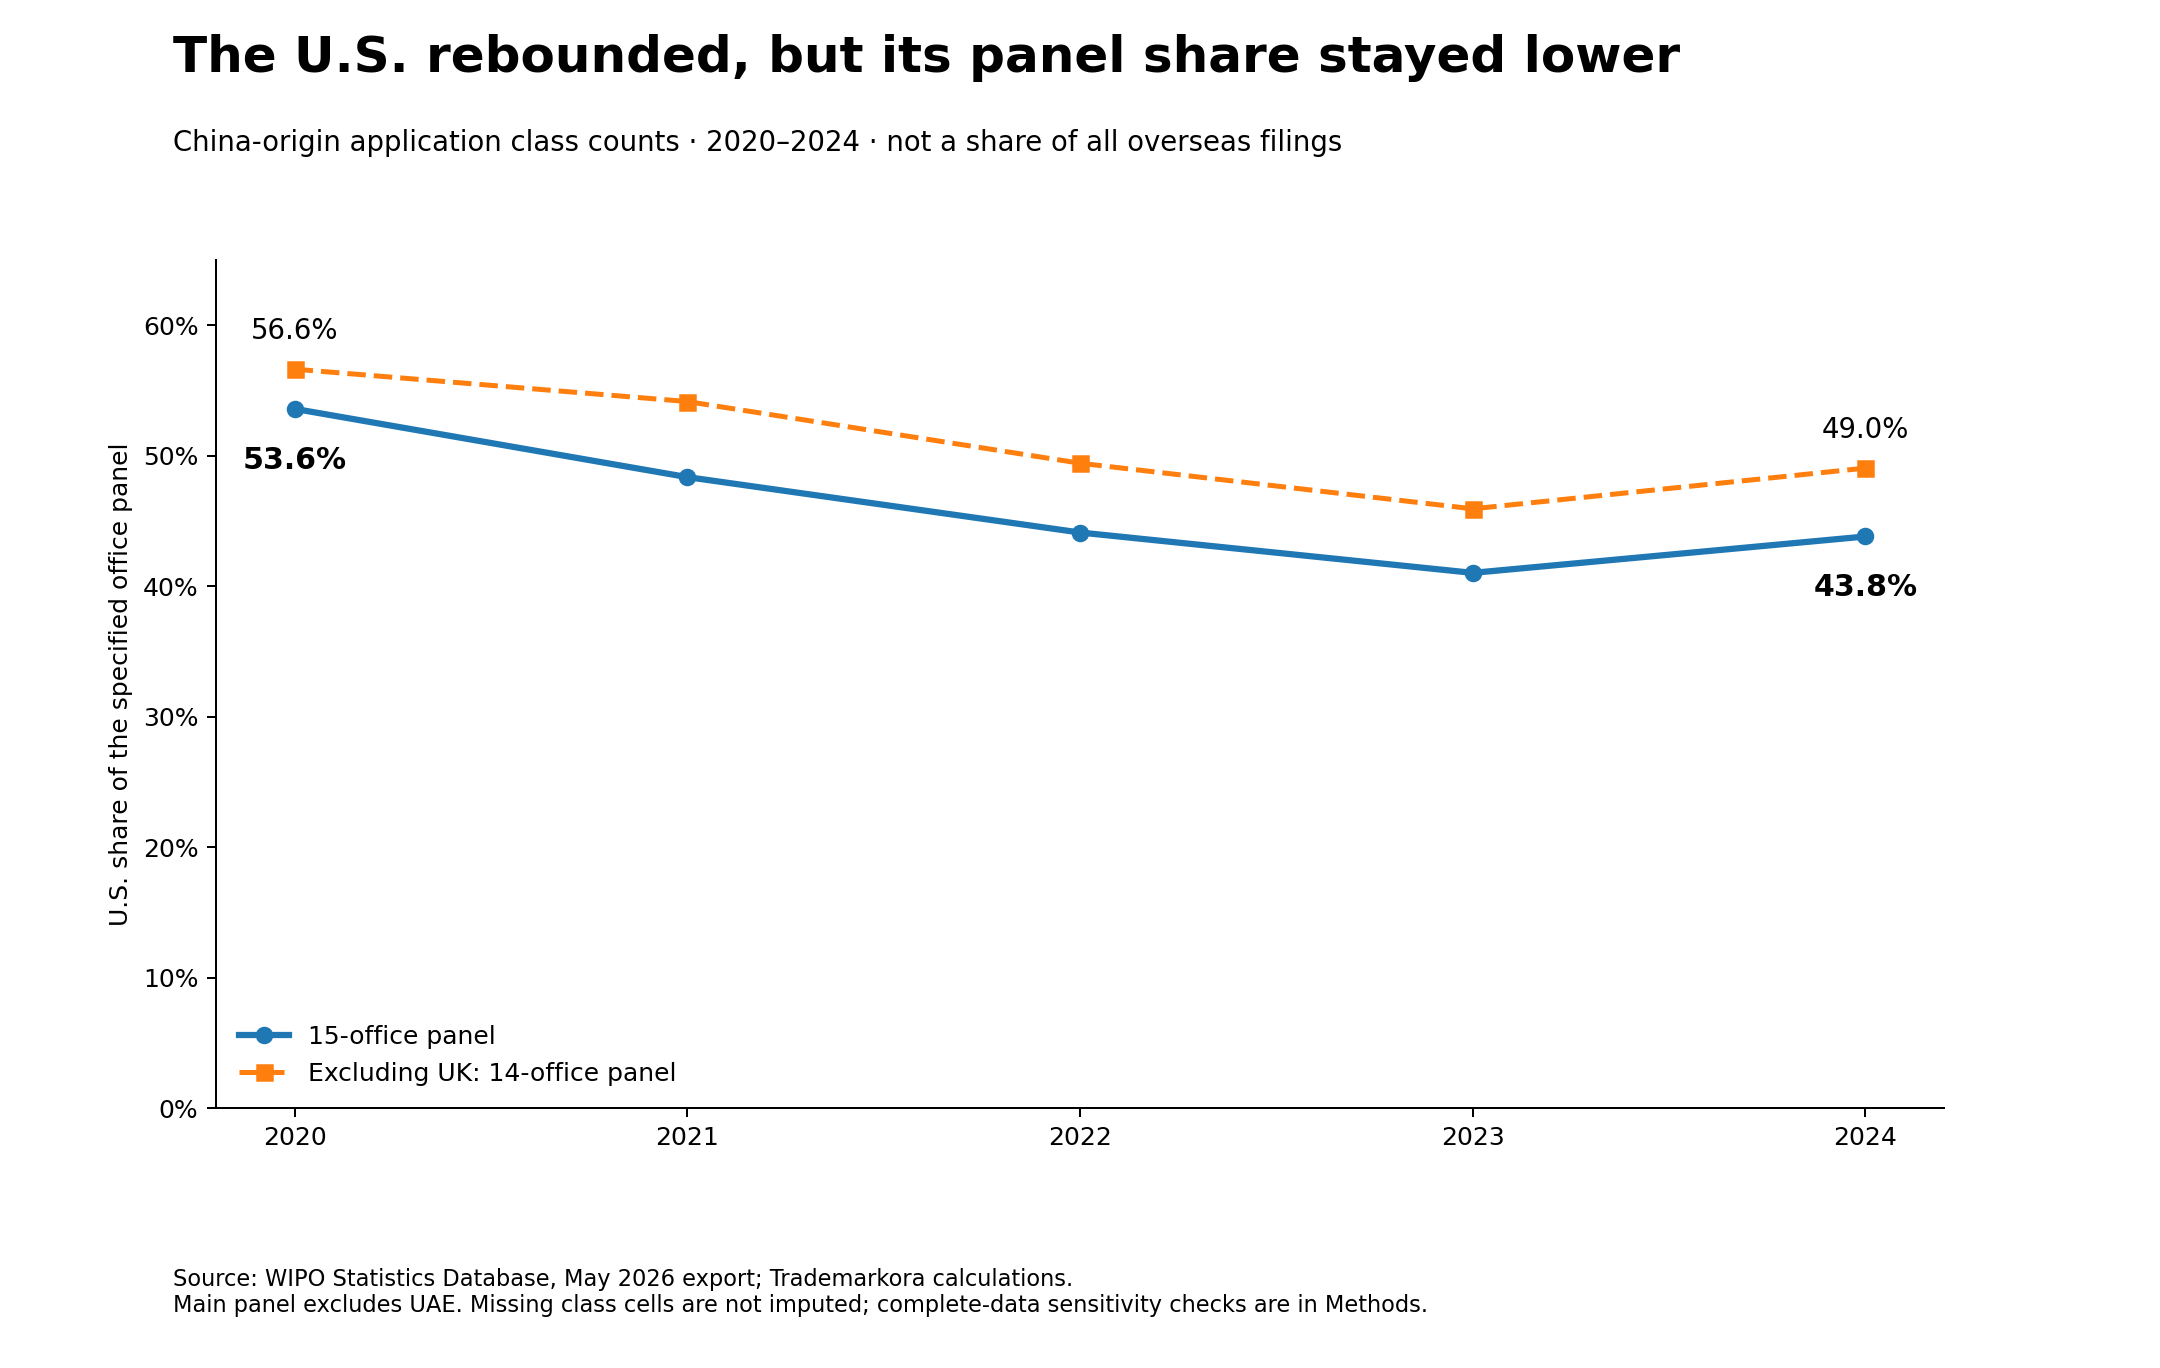
Source: WIPO Statistics Database;Trademarkora calculations. The package uses a May 2026 data vintage; see Methods for scope and caveats.
What this research observes
A trademark filing is a legal protection event, not a sales receipt. This report describes where Chinese-origin applicants sought protection and how the mix of classes changed. It does not establish actual sales, exports, successful market entry, the nationality of ultimate owners, or relocation of the same businesses.
The starting material is a user-exported WIPO table: Total applications by class (direct and via the Madrid system), counted by filing office and applicant origin for China and calendar years 2020–2024. A class count is not a unique application; a multiclass filing can contribute to more than one class. WIPO attributes origin using the residence of the first-named applicant. WIPO definitions and use terms。
Several destinations grew; this was not a one-country replacement story
Mexico’s reported class counts increased from 3,744 to 9,637 between 2020 and 2024, a gain of 157.4%. Australia increased from 6,179 to 13,870, up 124.5%; Viet Nam from 6,045 to 12,788, up 111.5%. Russia approximately doubled, while Brazil increased 88.9%. These changes began from different bases and should be read with absolute counts.
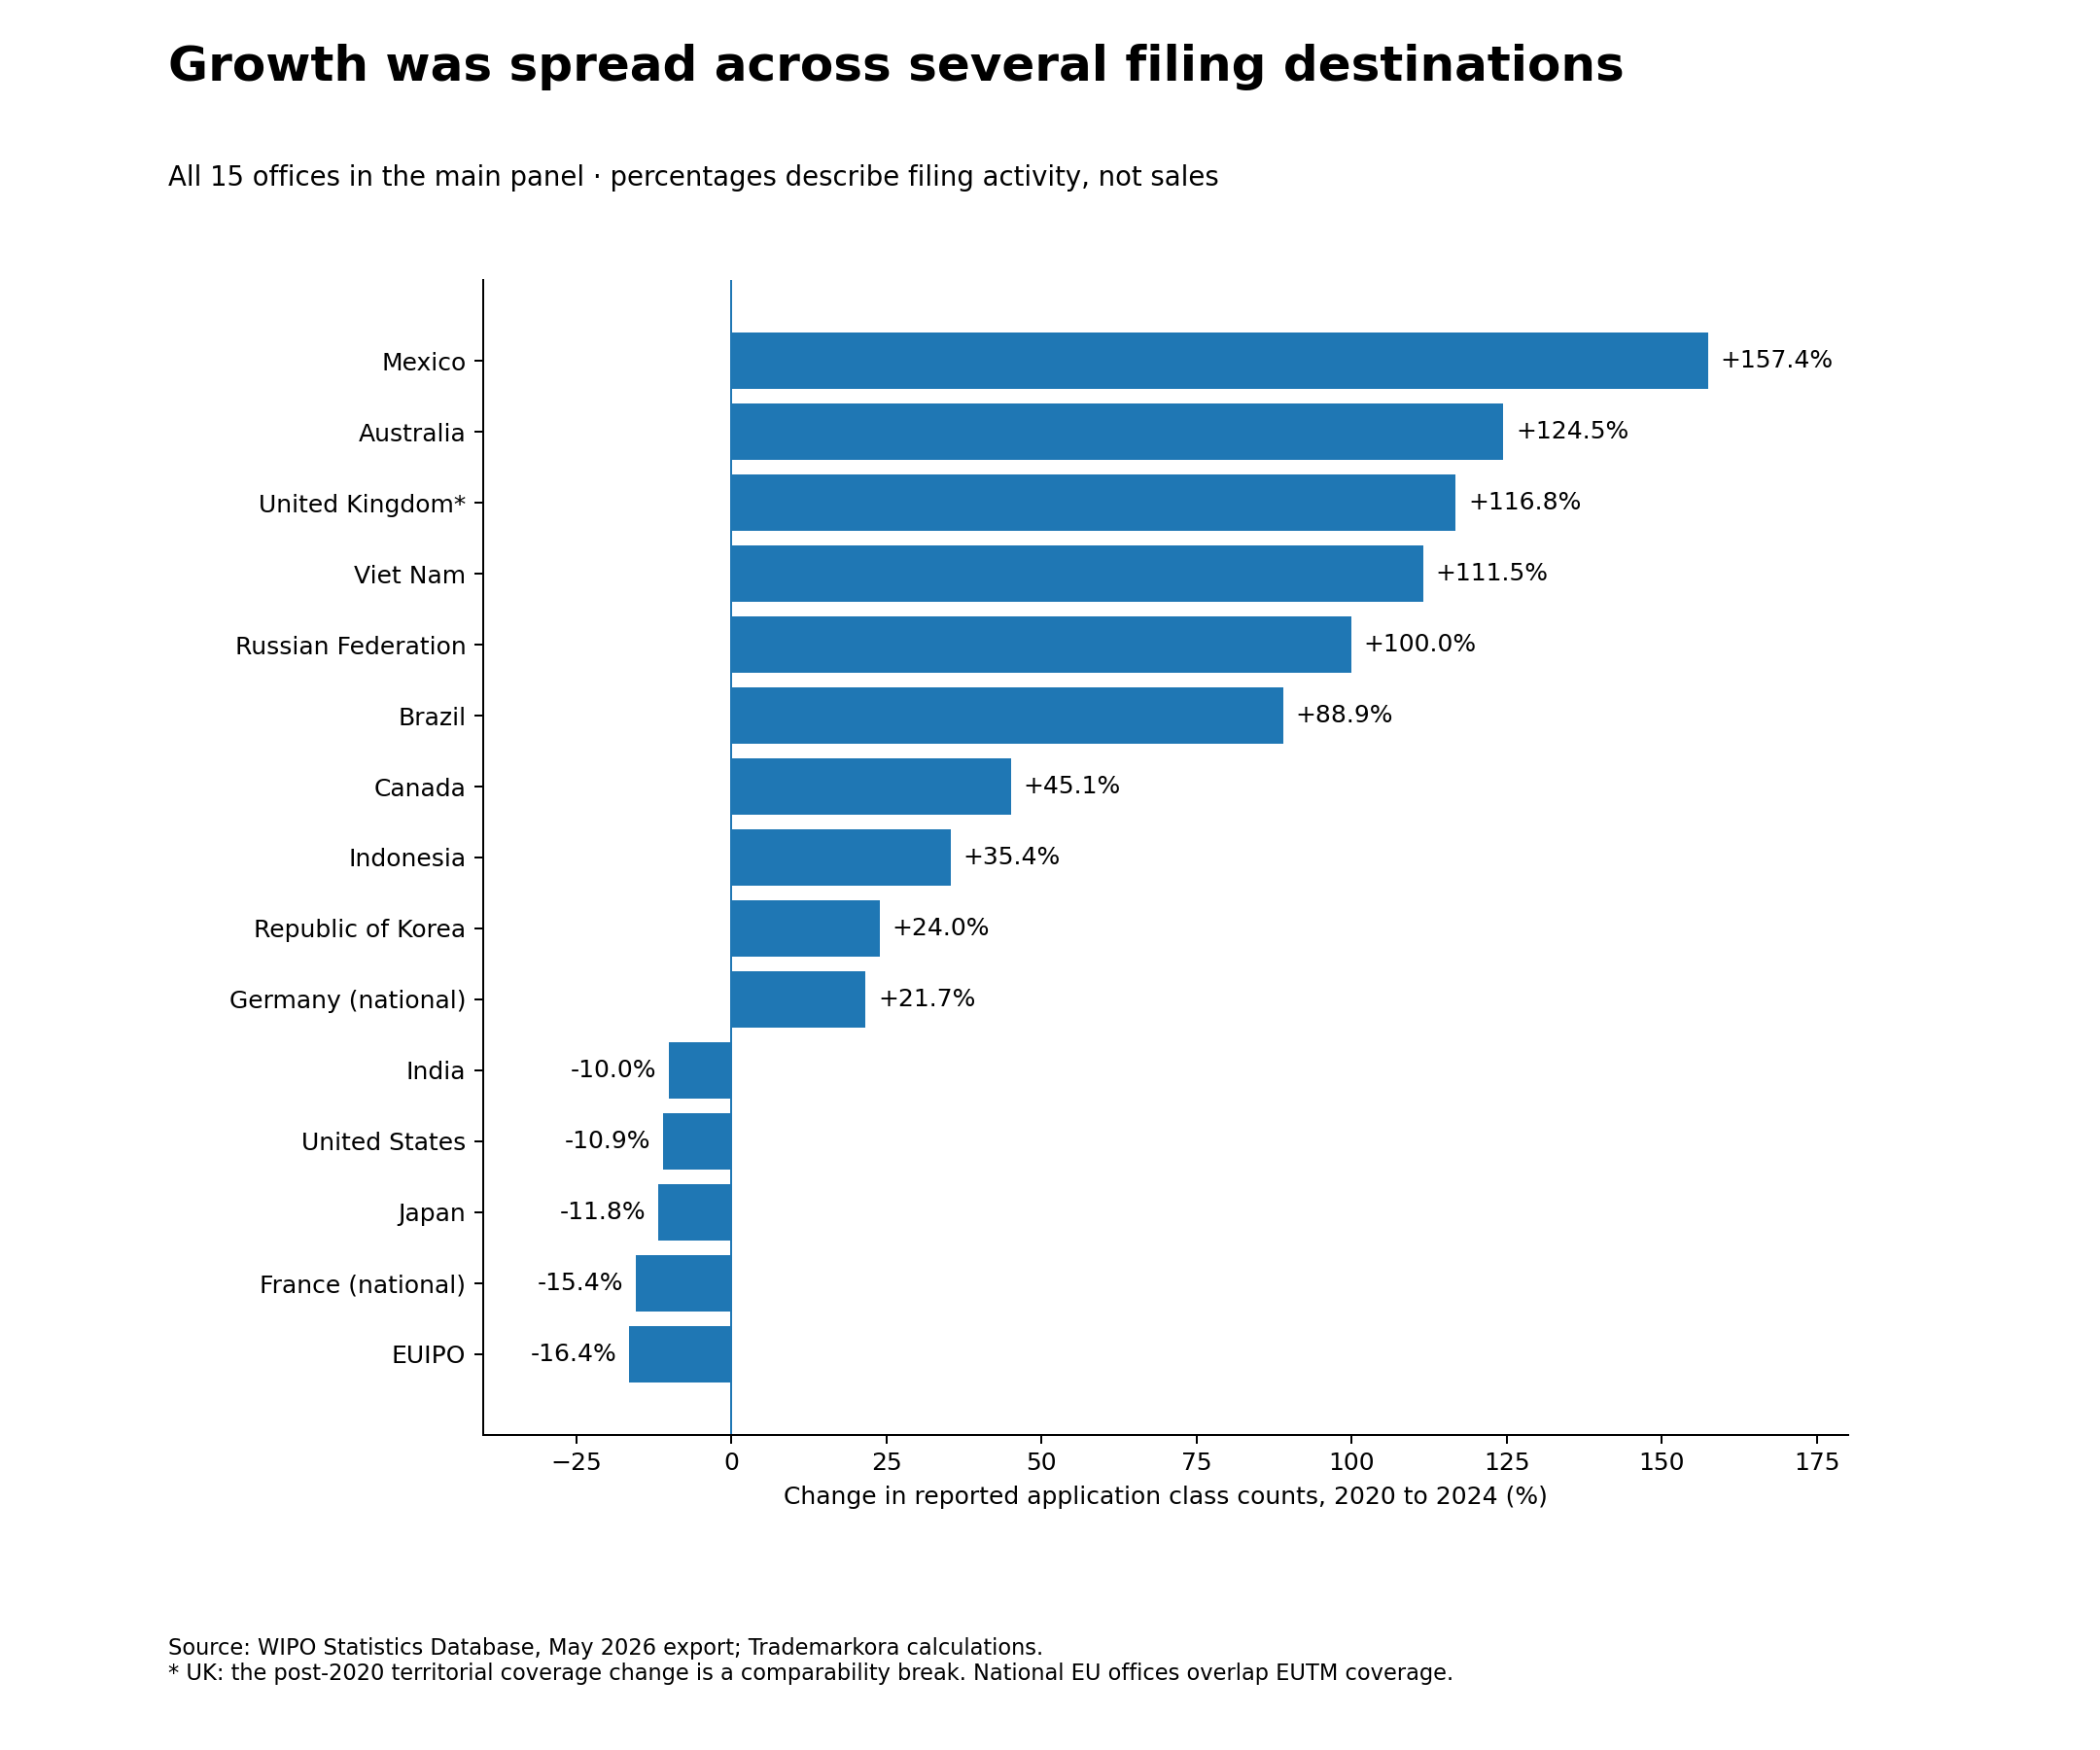
Source: WIPO Statistics Database;Trademarkora calculations. The package uses a May 2026 data vintage; see Methods for scope and caveats.
The U.S., EUIPO and Japan remained substantial destinations, but their 2024 counts were below 2020. The data show a rebound at the largest destination alongside faster growth in other channels. They do not show abandonment or one-for-one substitution.
The UK needs its own comparison
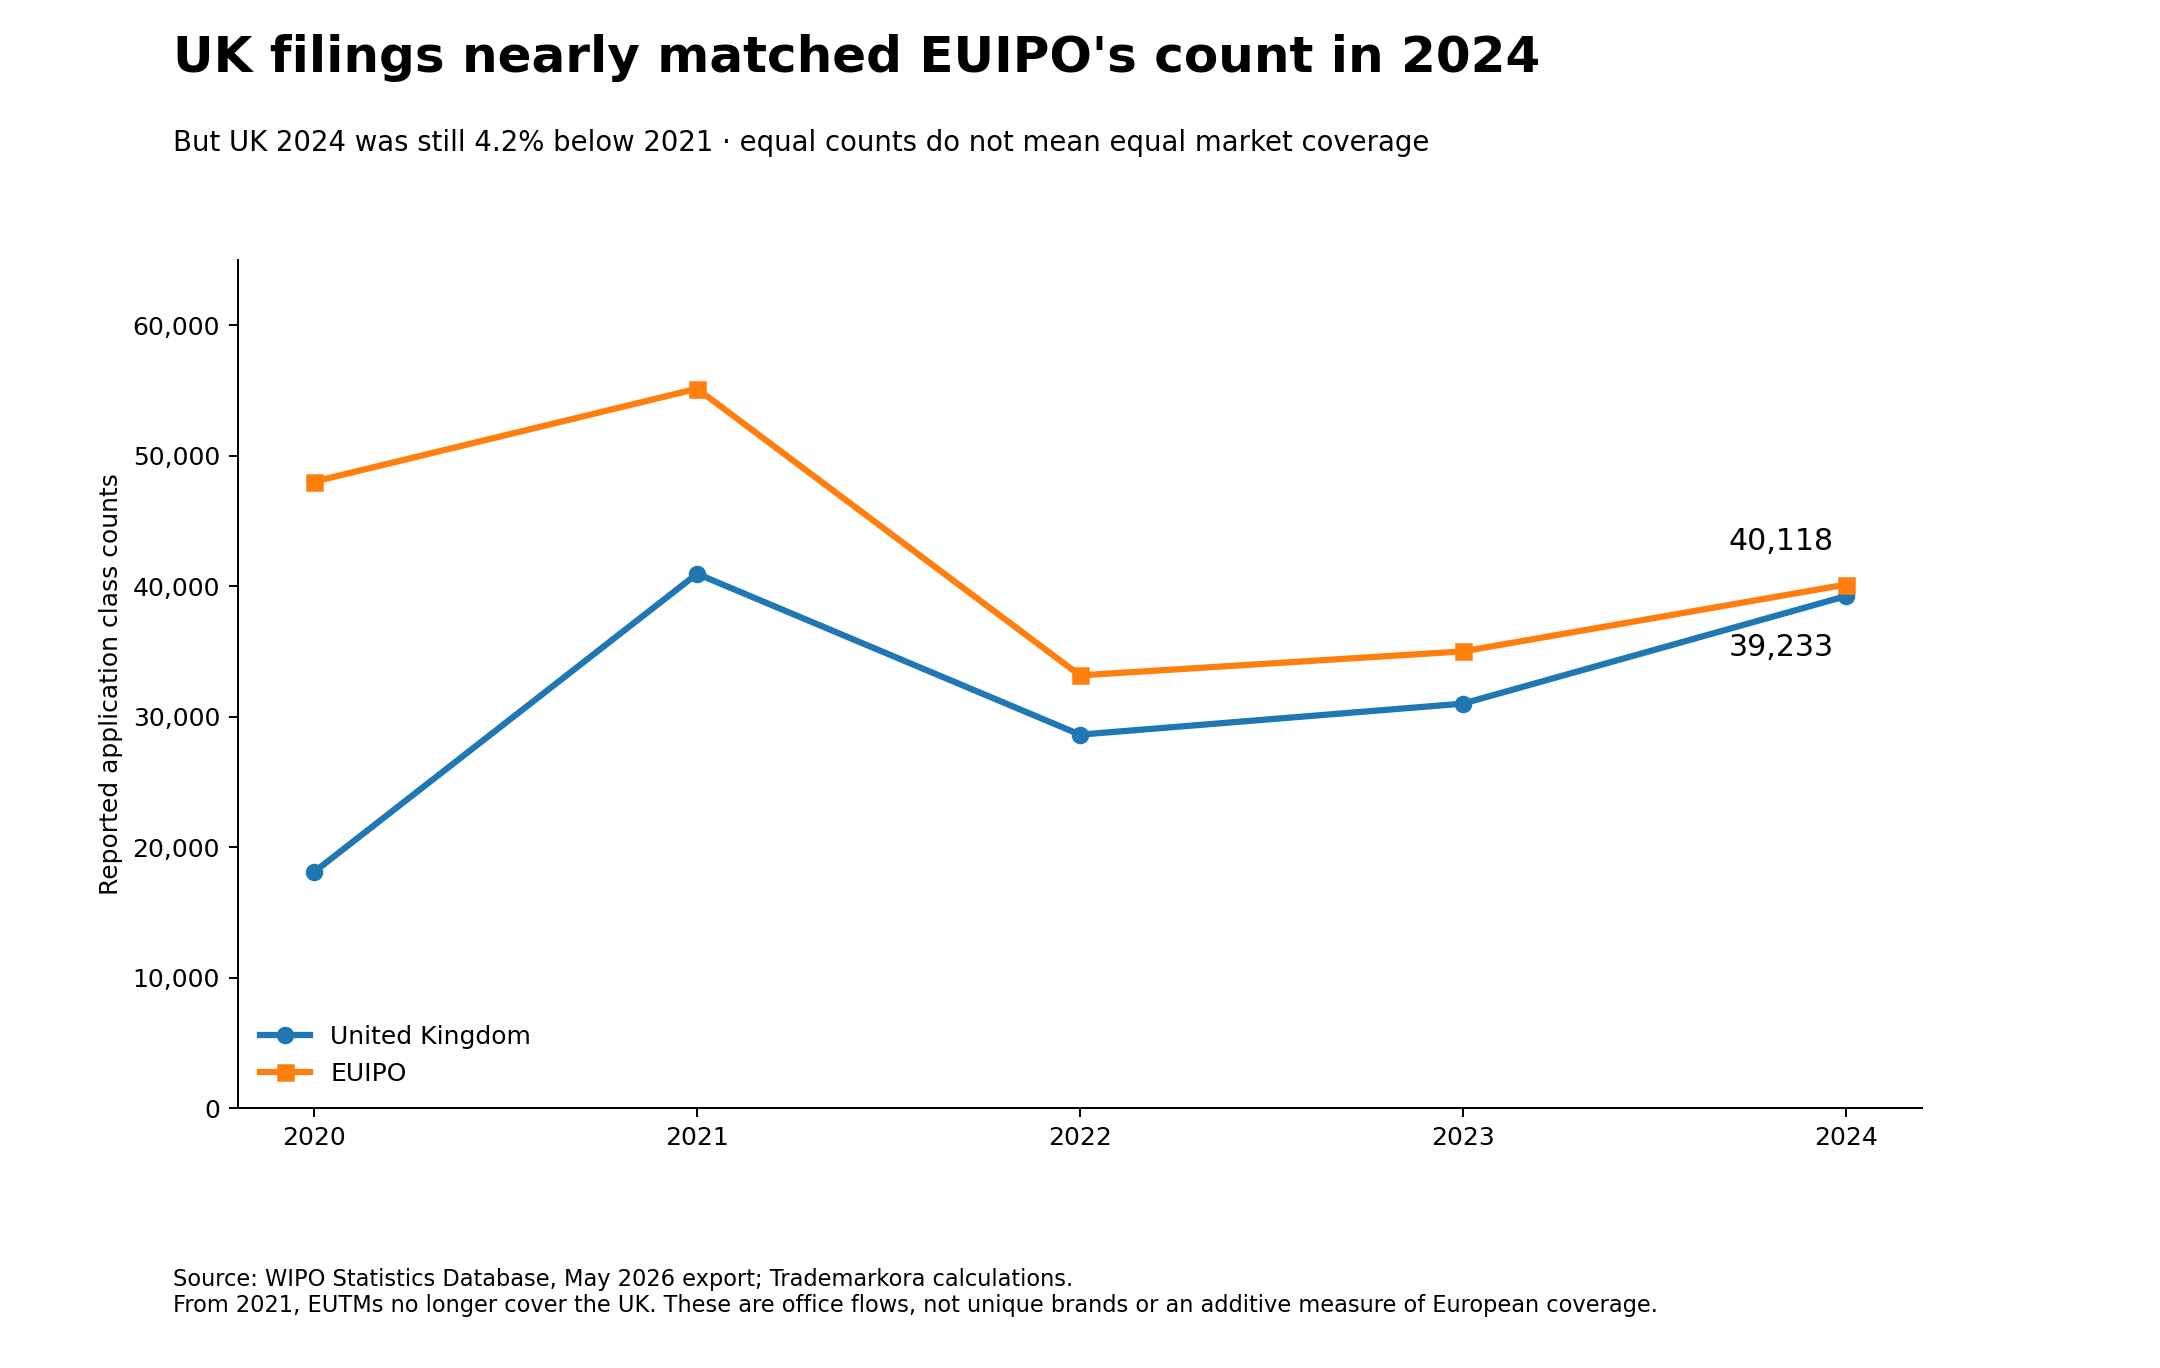
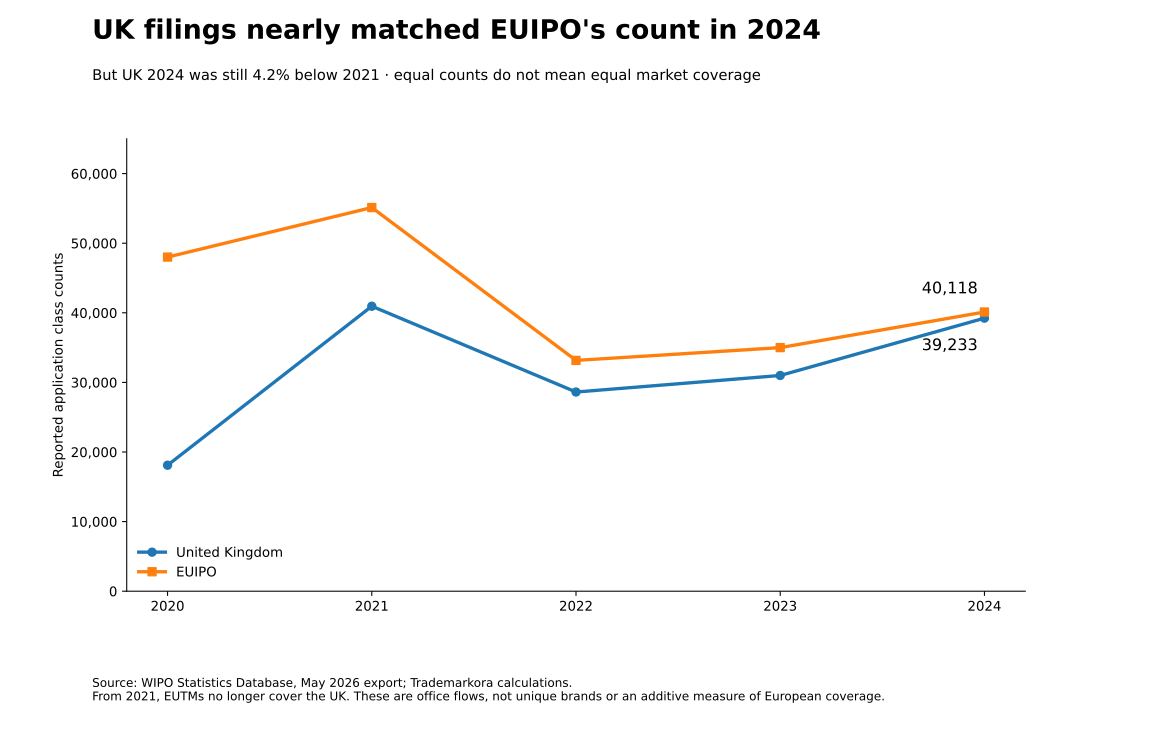
The UK’s reported Chinese-origin class counts were 18,100 in 2020, 40,947 in 2021, 28,619 in 2022, 30,996 in 2023 and 39,233 in 2024. Thus, 2024 was 116.8% above 2020, 26.6% above 2023 and 4.2% below 2021. Describing this as uninterrupted five-year growth would be wrong. UK IPO explanation。
Source: WIPO Statistics Database;Trademarkora calculations. The package uses a May 2026 data vintage; see Methods for scope and caveats.
Since 1 January 2021, EU trademarks no longer provide UK protection. The UK created comparable rights for existing registered EUTMs and provided a route for certain pending applications. This comparability issue is why the report does not present a simple league table.
A broader product mix, not a simple leap from clothing to technology
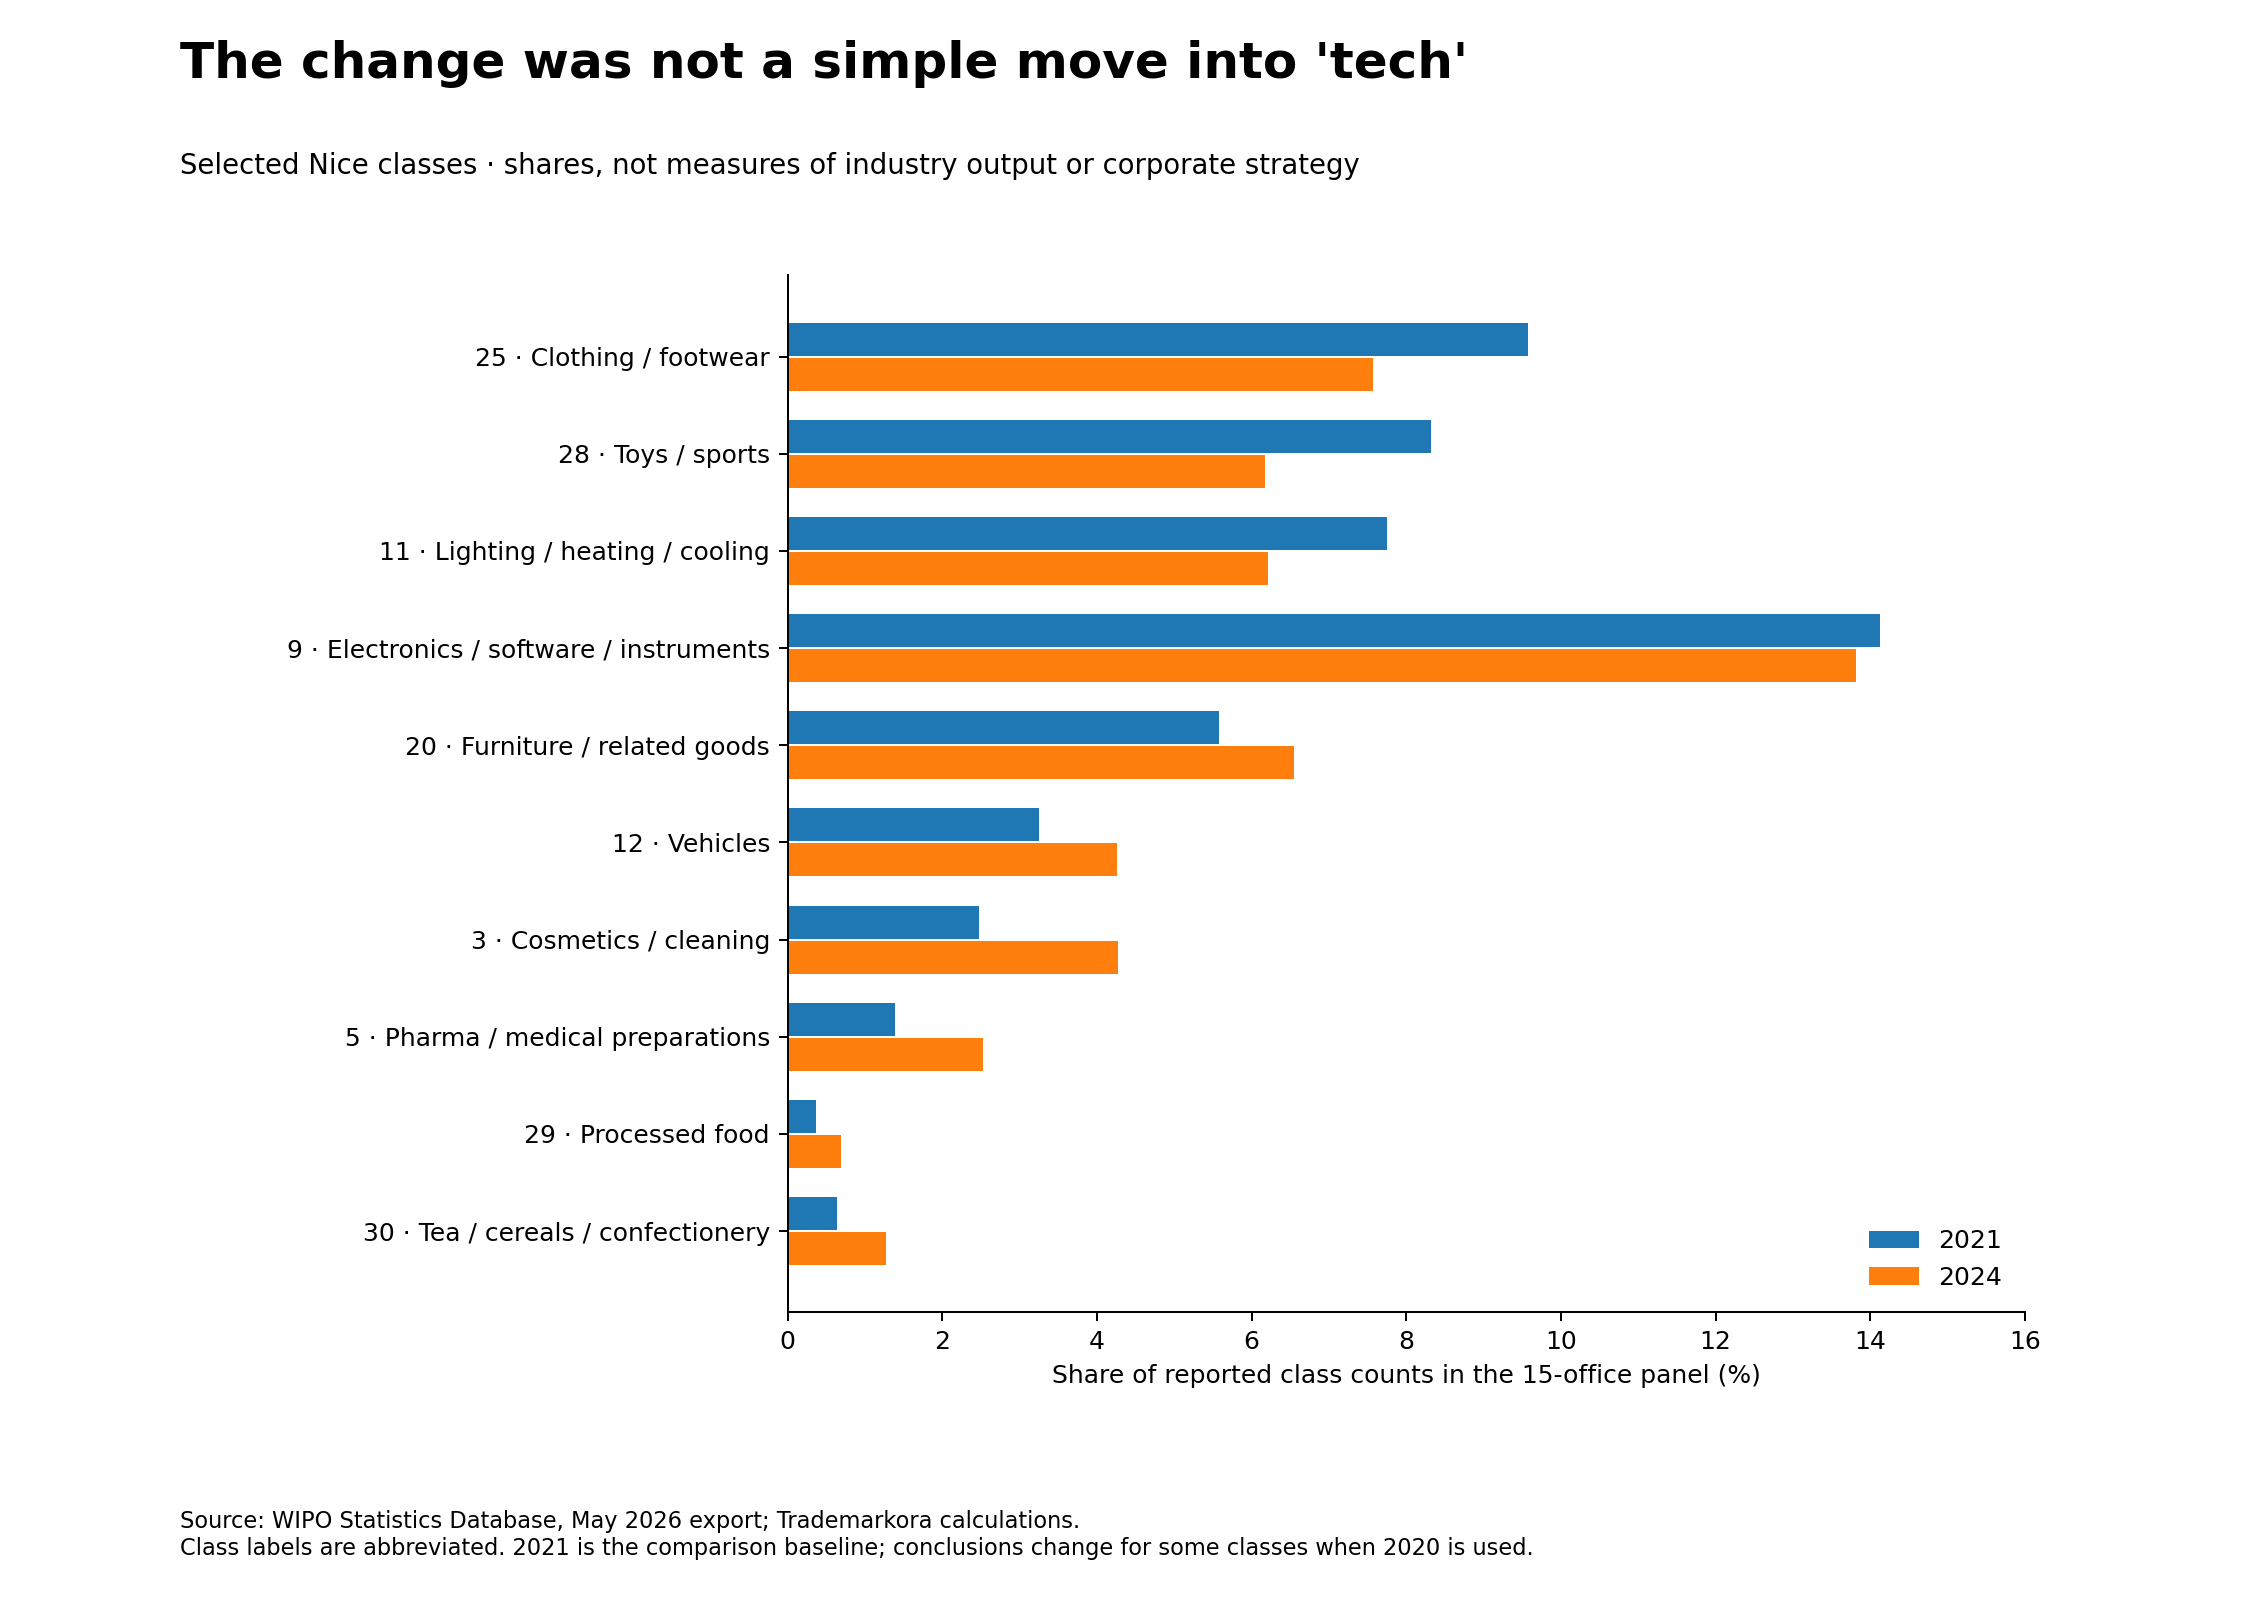
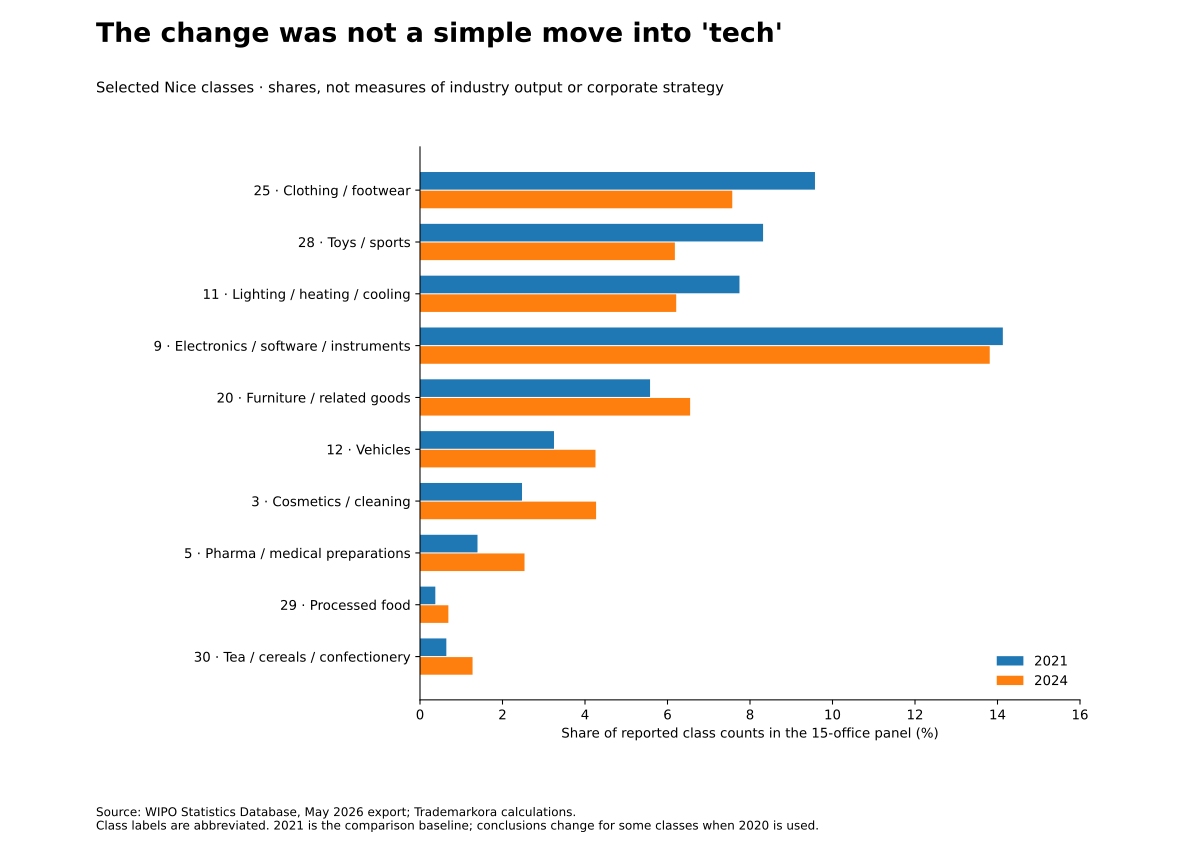
Class 3’s share in the 15-office panel rose from 2.47% in 2021 to 4.27% in 2024. Class 29 rose from 0.37% to 0.69%, and Class 30 from 0.64% to 1.27%. Class 9, the broad class containing electronics, software and scientific instruments, was 14.13% in 2021 and 13.81% in 2024.
Source: WIPO Statistics Database;Trademarkora calculations. The package uses a May 2026 data vintage; see Methods for scope and caveats.
The aggregate rejects the easy “apparel to technology” narrative; it does not demonstrate an absence of technological change. Class 12 does not prove an electric-vehicle story, Class 5 does not identify a specific pharmaceutical trend, and Class 3 does not distinguish beauty brands from cleaning products without goods-and-services descriptions.
Baseline and destination weights matter
Class 3 gained share in 11 of 15 offices from 2020 to 2024, Class 29 in nine and Class 30 in 12. The broadest common gains occur when 2021 is the comparison baseline, so the report keeps both baselines visible.
Source: WIPO Statistics Database;Trademarkora calculations. The package uses a May 2026 data vintage; see Methods for scope and caveats.
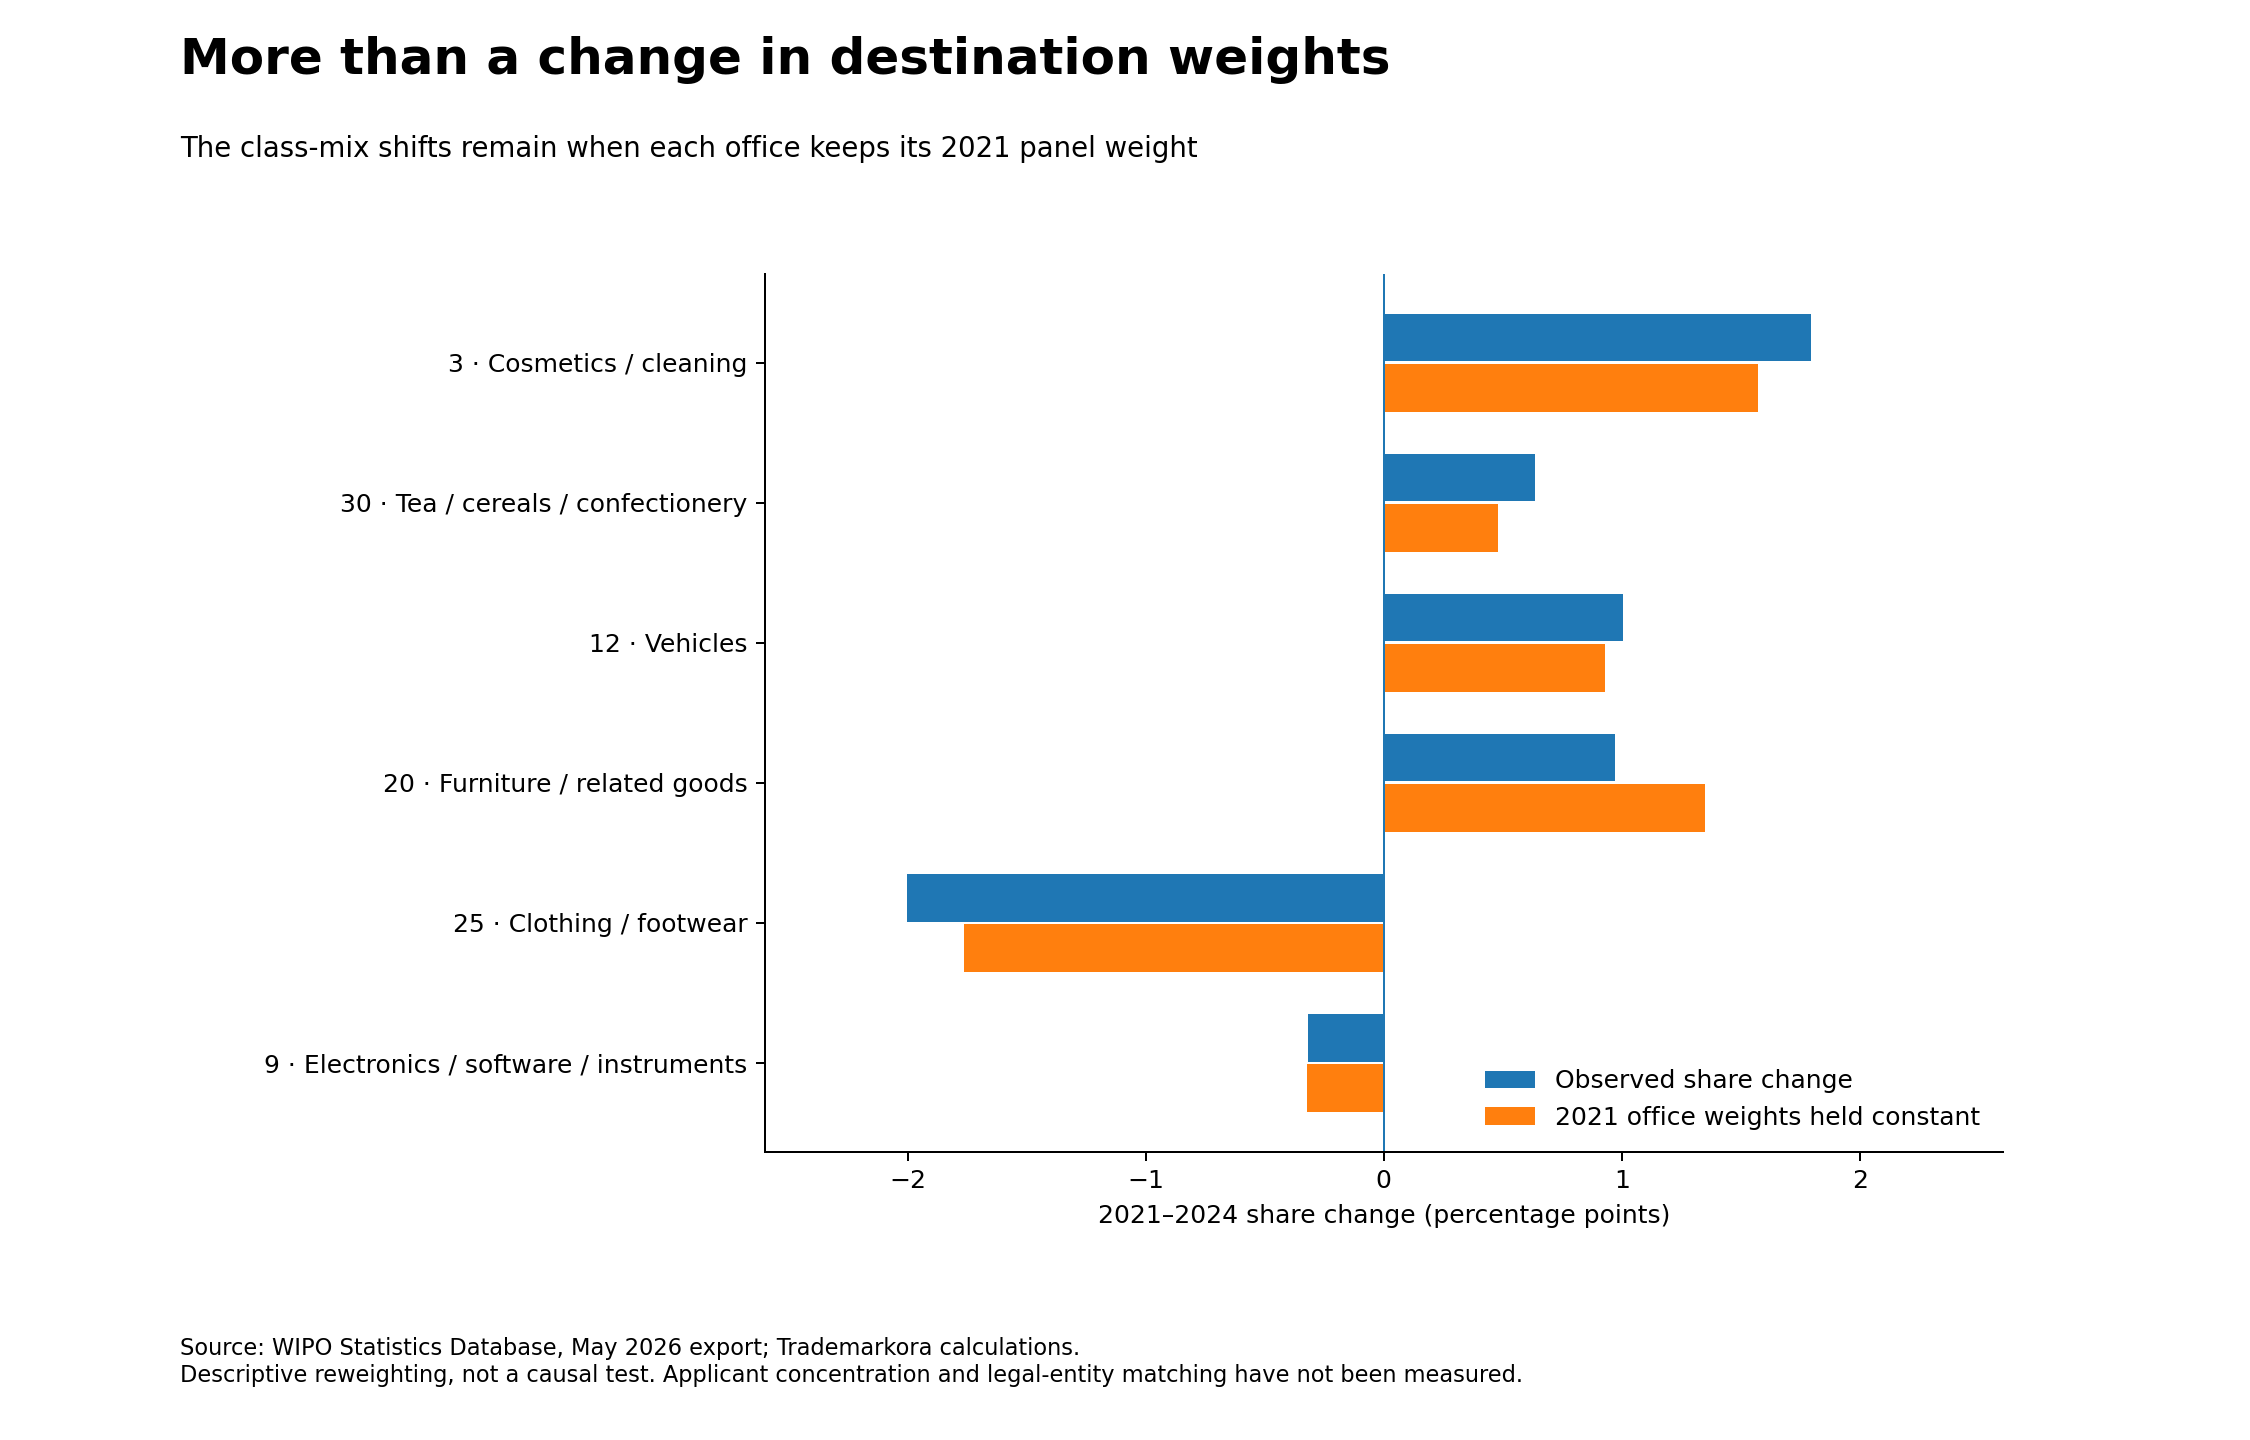
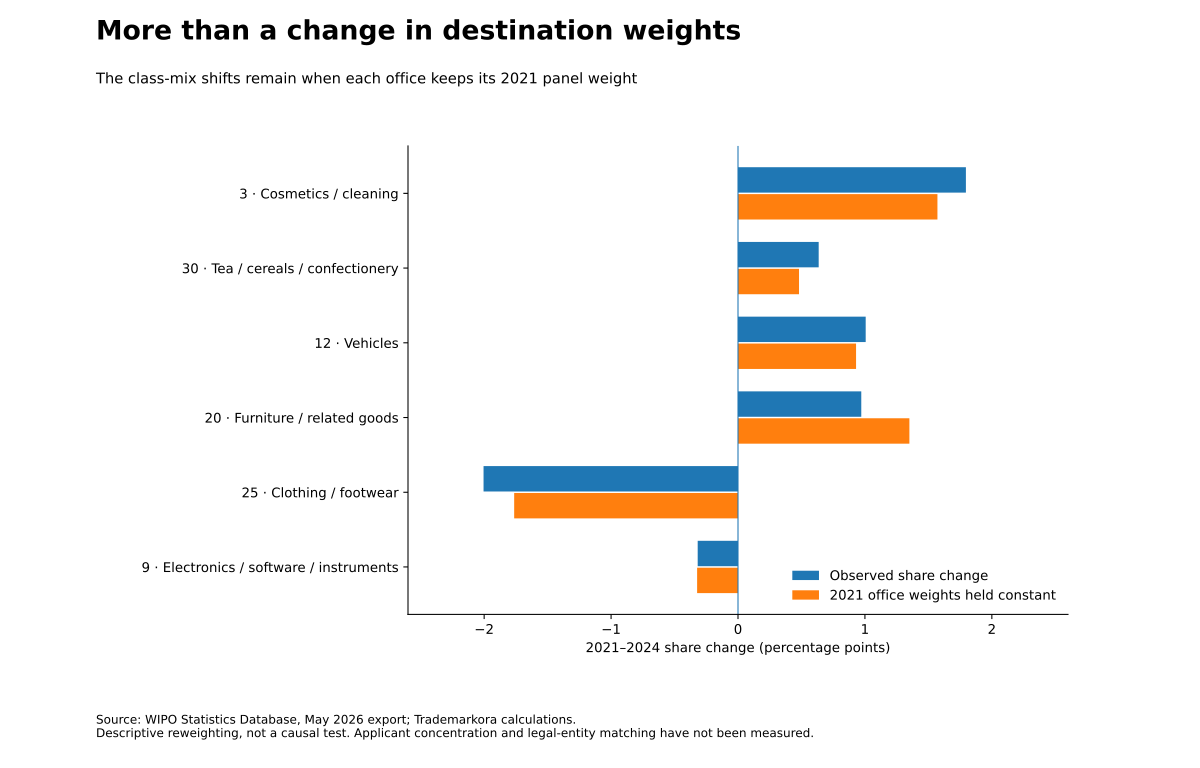
Holding each office’s 2021 panel weight constant leaves Class 3’s gain at 1.57 percentage points instead of 1.80, Class 30 at 0.48 instead of 0.64, and Class 12 at 0.93 instead of 1.01. This indicates that the selected class changes are not solely a destination-weight artefact.
Source: WIPO Statistics Database;Trademarkora calculations. The package uses a May 2026 data vintage; see Methods for scope and caveats.
What 2025 adds—and what it cannot add
The supplied WIPO series ends in 2024. We do not manufacture a fifth observation for a 2021–2025 panel. IP Australia’s Australian IP Report 2026 separately states that applications associated with Chinese residents grew 20.6% in 2025; this is a different official measure and is not appended to the WIPO class-count series. Read the Australian source。
Methods & data
Scope. The main analysis uses 15 selected offices: Australia, Brazil, Canada, Germany, EUIPO, France, the UK, Indonesia, India, Japan, the Republic of Korea, Mexico, Russia, the U.S. and Viet Nam. UAE is excluded from headline claims because of substantial missing/discontinuous observations. Germany and France are national-office channels; EUIPO is regional, and their territories overlap.
Unit. Total trademark applications by class, direct and via the Madrid system. Values are reported application-class counts, not unique applications, companies, sales, exports or market shares.
Missingness and checks. The supplied calculation package records 46 blank class-year cells, 37 in UAE and nine elsewhere. Blanks were not imputed as zero. The package manifest records zero conflicting duplicate values, 225 UK annual values checked and a passing formula-error scan. The internal audit CSV is retained as audit input, not a public download.
Scope limits. This is a selected office panel, not all Chinese overseas filings. The report has no applicant breadth, Top-1%-removal, new-versus-repeat or persistence analysis. Nice classes are broad, and the data do not identify causation.
Explore the underlying evidence
The current Trademarkora Data Lab is a later U.S. record-level snapshot of seven selected classes from September 2025 to August 2026. It is not the WIPO database behind this report. Classes 3, 29 and 30 are not part of the current Data Lab collection. Open the Data Lab。
Cite this research
Suggested citation for articles, briefings and chart reuse:
Lin, Peter. “Beyond the U.S. Rebound: The Changing Map of Chinese Trademark Filings.” Trademarkora Global Trademark Signals, Issue 01, 21 September 2026. WIPO Statistics Database, May 2026 data vintage.